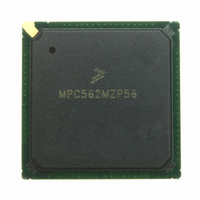
MPC562MZP56 Freescale Semiconductor, MPC562MZP56 Datasheet - Page 919

MPC562MZP56
Manufacturer Part Number
MPC562MZP56
Description
IC MPU 32BIT 56MHZ PPC 388-PBGA
Manufacturer
Freescale Semiconductor
Series
MPC5xxr
Datasheet
1.MPC561MZP56.pdf
(1420 pages)
Specifications of MPC562MZP56
Core Processor
PowerPC
Core Size
32-Bit
Speed
56MHz
Connectivity
CAN, EBI/EMI, SCI, SPI, UART/USART
Peripherals
POR, PWM, WDT
Number Of I /o
64
Program Memory Type
ROMless
Ram Size
32K x 8
Voltage - Supply (vcc/vdd)
2.5 V ~ 2.7 V
Data Converters
A/D 32x10b
Oscillator Type
External
Operating Temperature
-40°C ~ 125°C
Package / Case
388-BGA
Processor Series
MPC5xx
Core
PowerPC
Data Bus Width
32 bit
Data Ram Size
8 KB
Interface Type
SCI, SPI, UART
Maximum Clock Frequency
40 MHz
Number Of Programmable I/os
56
Number Of Timers
22
Operating Supply Voltage
2.6 V to 5 V
Maximum Operating Temperature
+ 85 C
Mounting Style
SMD/SMT
Minimum Operating Temperature
- 40 C
On-chip Adc
2 (10 bit, 32 Channel)
For Use With
MPC564EVB - KIT EVAL FOR MPC561/562/563/564
Lead Free Status / RoHS Status
Request inventory verification / Request inventory verification
Eeprom Size
-
Program Memory Size
-
Lead Free Status / Rohs Status
No
Available stocks
Company
Part Number
Manufacturer
Quantity
Price
Company:
Part Number:
MPC562MZP56
Manufacturer:
FREESCAL
Quantity:
204
Company:
Part Number:
MPC562MZP56
Manufacturer:
Freescale Semiconductor
Quantity:
10 000
Part Number:
MPC562MZP56
Manufacturer:
FREESCALE
Quantity:
20 000
Company:
Part Number:
MPC562MZP56R2
Manufacturer:
RFT
Quantity:
1 441
Company:
Part Number:
MPC562MZP56R2
Manufacturer:
Freescale Semiconductor
Quantity:
10 000
- Current page: 919 of 1420
- Download datasheet (11Mb)
Program trace can be used in various ways. Below are two examples of how program trace can be used:
23.1.4.1
The assertion/negation of VSYNC is done using the serial interface implemented in the development port.
In order to synchronize the assertion/negation of VSYNC to an internal event of the CPU, it is possible to
use the internal breakpoints together with debug mode. This method is available only when debug mode
is enabled. For more information on debug mode refer to
The following is an example of steps that enable synchronization of the trace window to the CPU internal
events:
Freescale Semiconductor
•
•
1. Enter debug mode, either immediately out of reset or using the debug mode request
2. Program the hardware to break on the event that marks the start of the trace window using the
3. Enable debug mode entry for the programmed breakpoint in the debug enable register (DER). See
4. Return to the regular code run (see
5. The hardware generates a breakpoint when the programmed event is detected and the machine
6. Program the hardware to break on the event that marks the end of the trace window
7. Assert VSYNC
8. Return to the regular code run. The first report on the VF pins is a VSYNC (VF = 011).
9. The external hardware starts sampling the program trace information upon the report on the VF
10. The hardware generates a breakpoint when the programmed event is detected and the machine
Back trace — Back trace is useful when a record of the program trace before some event occurred
is needed. An example of such an event is some system failure.
In case back trace is needed the external hardware should start sampling the status pins (VF and
VFLS) and the address of all cycles marked with the program trace cycle attribute immediately
when reset is negated. If show cycles is programmed out of reset to show all, all cycles marked
with program trace cycle attribute are visible on the external bus. VSYNC should be asserted
sometime after reset and negated when the programmed event occurs. If no show is programmed
for show cycles, make sure VSYNC is asserted before the Instruction show cycles programming is
changed from show all.
Note that in case the timing of the programmed event is unknown it is possible to use cyclic buffers.
After VSYNC is negated the trace buffer will contain the program flow trace of the program
executed before the programmed event occurred.
Window trace — Window trace is useful when a record of the program trace between two events
is needed. In case window trace is needed the VSYNC pin should be asserted between these two
events.
After the VSYNC pin is negated the trace buffer will contain information describing the program
trace of the program executed between the two events.
control registers defined in
Section 23.6.13, “Development Port Data Register
enters debug mode (see
pins of VSYNC
enters debug mode
Synchronizing the Trace Window to the CPU Internal Events
Section 23.3.1.2, “Entering Debug
MPC561/MPC563 Reference Manual, Rev. 1.2
Section 23.2, “Watchpoints and Breakpoints
Section 23.3.1.6, “Exiting Debug
Section 23.3, “Development System
(DPDR)”)
Mode”)
Mode”)
Support”
Development Support
Interface.”
23-5
Related parts for MPC562MZP56
Image
Part Number
Description
Manufacturer
Datasheet
Request
R
Part Number:
Description:
Mpc562 32 Bit Powerpc Microcontroller
Manufacturer:
Freescale Semiconductor, Inc
Datasheet:

Part Number:
Description:
MPC5 1K0 5%
Manufacturer:
TE Connectivity
Datasheet:

Part Number:
Description:
MPC5 500R 5%
Manufacturer:
TE Connectivity
Datasheet:

Part Number:
Description:
MPC5 5K0 5%
Manufacturer:
Tyco Electronics
Datasheet:

Part Number:
Description:
MPC5 5R0 5%
Manufacturer:
Tyco Electronics
Datasheet:

Part Number:
Description:
MPC5 50K 5%
Manufacturer:
Tyco Electronics
Datasheet:
Part Number:
Description:
Manufacturer:
Freescale Semiconductor, Inc
Datasheet:
Part Number:
Description:
Manufacturer:
Freescale Semiconductor, Inc
Datasheet:
Part Number:
Description:
Manufacturer:
Freescale Semiconductor, Inc
Datasheet:
Part Number:
Description:
Manufacturer:
Freescale Semiconductor, Inc
Datasheet:
Part Number:
Description:
Manufacturer:
Freescale Semiconductor, Inc
Datasheet:


