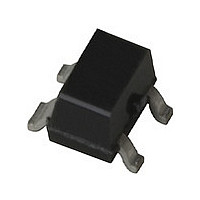
MSA-2643-BLK Avago Technologies US Inc., MSA-2643-BLK Datasheet - Page 12

MSA-2643-BLK
Manufacturer Part Number
MSA-2643-BLK
Description
Manufacturer
Avago Technologies US Inc.
Datasheet
1.MSA-2643-BLK.pdf
(15 pages)
Specifications of MSA-2643-BLK
Manufacturer's Type
MMIC Amplifier
Number Of Channels
1
Supply Current
70mA
Frequency (max)
6GHz
Operating Supply Voltage (min)
3V
Operating Supply Voltage (typ)
3.4V
Operating Supply Voltage (max)
3.8V
Package Type
SOT-343
Mounting
Surface Mount
Pin Count
3 +Tab
Noise Figure (typ)
3.6@2000MHzdB
Lead Free Status / Rohs Status
Not Compliant
1
900 MHz Design
The 900 MHz example follows
the same design approach that
was described in the previous
1900 MHz design. A schematic
diagram of the complete 900 MHz
circuit is shown in Figure 8. And
the component part list is show in
Table 3.
Figure 8. Schematic of 900 MHz Circuit.
Table 3. Component Parts List for the
MSA-2643 Amplifier at 900 MHz.
R1
RFC
C1,C
C3
Performance of MSA-2643
900 MHz Amplifier
The amplifier is biased at a Vcc of
5 volts, I
gain, noise figure, input and output
return loss of the completed am-
plifier is shown in Figure 9. Noise
figure is a nominal 3.8 to 4.0 dB
from 800 through 1000 MHz. Gain
is a minimum of 17.1 dB from 800
MHz through 1000 MHz. The input
return loss at 900 MHz is 15.2 dB
with a corresponding output re-
turn loss of 16.9 dB. The amplifier
output intercept point (OIP3) was
measured at a nominal +28.2 dBm.
P
Figure 9. Gain, Noise Figure, Input and Output
Return Loss Results.
-1dB
Figure 9. Gain, Noise Figure,Input
and Output Return Loss Results.
C1=39 pf
-10
-15
-20
measured +14.6 dBm.
20
15
10
-5
5
0
0.4
d
26x
of 40 mA. The measured
39Ω chip resistor
47 nH LL1608-FH47N
39 pF chip capacitor
680 pF chip capacitor
0.6
Output RL
FREQUENCY (GHz)
47 nH
RFC=
0.8
Rc=39Ω
C2=39 pF
1.0
C3=680 pF
Gain
Noise
Input RL
1.2
Vcc=5V
1.4
Designs for Other Frequencies
The same basic design approach
described above for 1.9 GHz can
be applied to other frequency
bands. Inductor values for match-
ing the input for low noise figure
are shown in Table 4.
Table 4. Input and Output Inductor Values for
Various Operating Frequencies.
Frequency
400 MHz
900 MHz
1900 MHz
.4 GHz
3.5 GHz
5.8 GHz
Actual component values may
differ slightly from those shown in
Table 3 due to variations in circuit
layout, grounding, and component
parasitics. A CAD program such
as Avago Technologies’ ADS
recommended to fully analyze and
account for these circuit variables.
Notes on RF Grounding
The performance of the MSA
series is sensitive to ground path
inductance. Good grounding is
critical when using the MSA-2643.
The use of via holes or equivalent
minimal path ground returns as
close to the package edge as is
practical is recommended to as-
sure good RF grounding. Multiple
vias are used on the evaluation
board to reduce the inductance
of the path to ground. The ef-
fects of the poor grounding may
be observed as a “peaking” in the
gain versus frequency response,
an increase in input VSWR, or
even as return gain at the input of
the RFIC.
C1 & C, pF RFC, nH
88
39
18
15
18
1.8
100
47
18
15
6.8
®
C3, pF
1500
680
330
70
10
is
A Final Note on Performance
Actual performance of the MSA
RFIC mounted on the demonstra-
tion board may not exactly match
data sheet specifications. The
board material, passive compo-
nents, and connectors all intro-
duce losses and parasitics that
may degrade device performance,
especially at higher frequencies.
Some variation in measured
results is also to be expected as a
result of the normal manufactur-
ing distribution of products.
Statistical Parameters
Several categories of parameters
appear within this data sheet.
Parameters may be described with
values that are either “minimum or
maximum,” “typical,” or “standard
deviations.”
The values for parameters are
based on comprehensive product
characterization data, in which
automated measurements are
made on of a minimum of 500
parts taken from six non-consecu-
tive process lots of semiconductor
wafers. The data derived from
product characterization tends to
be normally distributed, e.g., fits
the standard bell curve.
Parameters considered to be the
most important to system perfor-
mance are bounded by minimum
or maximum values. For the
MSA-2643, these parameters are:
Gain (G
(V
rameters is 100% tested as part of
the manufacturing process.
d
). Each of the guaranteed pa-
test
) and Device Voltage


