AD8312ACBZ-P7 Analog Devices Inc, AD8312ACBZ-P7 Datasheet - Page 15
AD8312ACBZ-P7
Manufacturer Part Number
AD8312ACBZ-P7
Description
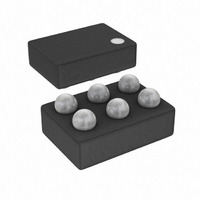
IC DETECTOR RF LOGIC 6-WLCSP
Manufacturer
Analog Devices Inc
Type
Logarithmic Amplifierr
Datasheet
1.AD8312ACBZ-P7.pdf
(20 pages)
Specifications of AD8312ACBZ-P7
Rf Type
Cellular, GSM, CDMA, W-CDMA
Frequency
50MHz ~ 3.5GHz
Input Range
-45dBm ~ 0dBm
Accuracy
±1dB
Voltage - Supply
2.7 V ~ 5.5 V
Current - Supply
5.7mA
Package / Case
6-UFBGA, 6-uCSP
Frequency Range
50MHz To 3.5GHz
Power Range
-45dBm To 0dBm
Sensitivity
0.0073dB/°C
Supply Current
4.2mA
Supply Voltage Range
2.7V To 5.5V
Rf Ic Case Style
WLCSP
Number Of Channels
1
Number Of Elements
1
Power Supply Requirement
Single
Input Resistance
0.013MOhm
Input Bias Current
75uA
Single Supply Voltage (typ)
3V
Dual Supply Voltage (typ)
Not RequiredV
Power Dissipation
200mW
Rail/rail I/o Type
No
Single Supply Voltage (min)
2.7V
Single Supply Voltage (max)
5.5V
Dual Supply Voltage (min)
Not RequiredV
Dual Supply Voltage (max)
Not RequiredV
Operating Temp Range
-40C to 85C
Operating Temperature Classification
Industrial
Mounting
Surface Mount
Pin Count
6
Package Type
WLCSP
Lead Free Status / RoHS Status
Lead free / RoHS Compliant
Lead Free Status / RoHS Status
Lead free / RoHS Compliant, Lead free / RoHS Compliant
Other names
AD8312ACBZ-P7
AD8312ACBZ-P7TR
AD8312ACBZ-P7TR
Available stocks
Company
Part Number
Manufacturer
Quantity
Price
Company:

Part Number:
AD8312ACBZ-P7
Manufacturer:
ADI
Quantity:
9 000
Company:
Part Number:
AD8312ACBZ-P7
Manufacturer:
ST
Quantity:
320


Table 5. Input Impedance for Select Frequency
Frequency
(GHz)
0.05
0.1
0.9
1.9
2.2
2.5
3.0
3.5
Increasing the Logarithmic Slope
The nominal logarithmic slope of 20 mV/dB can be increased to
an arbitrarily high value by attenuating the signal between VOUT
and VSET, as shown in Figure 27. The ratio R1/R2 is set by
In the example shown, two 2 kΩ resistors combine to change
the slope at 1900 MHz from approximately 20 mV/dB to
40 mV/dB. Note that R2 is in parallel with the input resistance of
VSET, typically 13 kΩ. Therefore, the exact R1/R2 ration may vary.
The slope can be increased to higher levels, as shown in
Figure 28. This, however, reduces the usable dynamic range of
the device, depending on the supply voltage.
Output loading should be considered when choosing resistor
values for slope adjustment to ensure proper output swing.
Note that the load resistance on VOUT should not be lower
than 4 kΩ in order that the full-scale output can be generated
with the limited available current of 1 mA.
R1
/
R2
=
⎛
⎜
⎜
⎝
Original
Figure 27. Increasing the Output Slope
AD8312
New
Real
0.967
0.962
0.728
0.322
0.230
0.165
0.126
0.146
Slope
VOUT
VSET
Slope
Imaginary
−0.043
−0.081
−0.535
−0.891
−0.832
−0.845
−0.849
−0.826
⎞
⎟
⎟
⎠
S11
−
1
R1
2kΩ
R2
2kΩ
~40mV/dB
@ 1900MHz
Impedance Ω
(Series)
1090 − j 1461
422.6 − j 1015
25.6 − j 148.5
11.5 − j 72.69
9.91 − j 64.74
9.16 − j 59.91
8.83 − j 57.21
10.5 − j 58.54
Rev. A | Page 15 of 20
Effect of Waveform Type on Intercept
Although specified for input levels in dBm (dB relative to
1 mW), the AD8312 fundamentally responds to voltage and not
to power. A direct consequence of this characteristic is that
input signals of equal rms power but differing crest factors,
produce different results at the log amplifier’s output.
The effect of differing signal waveforms is to shift the effective
value of the intercept upwards or downwards. Graphically, this
looks like a vertical shift in the log amplifier’s transfer function.
The logarithmic slope, however, is not affected. For example,
consider the case of the AD8312 being alternately fed by an
unmodulated sine wave and by a 64 QAM signal of the same
rms power. The AD8312’s output voltage differs by the
equivalent of 1.6 dB (31 mV) over the complete dynamic range
of the device (with the output for a 64 QAM input being lower).
Figure 29 shows the transfer function of the AD8312 when
driven by both an unmodulated sine wave and several different
signal waveforms. For precision operation, the AD8312 should
be calibrated for each signal type that is driving it. To measure
the rms power of a 64 QAM input, for example, the mV
equivalent of the dB value (19.47 mV/dB × 1.6 dB) should be
subtracted from the output voltage of the AD8312.
4.0
3.5
3.0
2.5
2.0
1.5
1.0
0.5
0
–60
Figure 28. VOUT vs. Input Level at Various Logarithmic Slopes
–50
–40
3.0
–30
P
×
IN
2.0
(dBm)
×
1.0
–20
×
–10
SUPPLY
SUPPLY
5.0V
AD8312
0
2.7V
10
Related parts for AD8312ACBZ-P7
Image
Part Number
Description
Manufacturer
Datasheet
Request
R

Part Number:
Description:
High-Performance, Low Distortion 500-MHz Mixer
Manufacturer:
Analog Devices
Datasheet:

Part Number:
Description:
MIXER IC
Manufacturer:
Analog Devices Inc
Datasheet:
Part Number:
Description:
MIXER IC
Manufacturer:
Analog Devices Inc
Datasheet:

Part Number:
Description:
±1.7g Dual-Axis IMEMS Accelerometer Evaluation Board
Manufacturer:
Analog Devices Inc
Datasheet:

Part Number:
Description:
Inertial Sensor Evaluation System
Manufacturer:
Analog Devices Inc
Datasheet:
Part Number:
Description:
Manufacturer:
Analog Devices Inc
Datasheet:
Part Number:
Description:
Manufacturer:
Analog Devices Inc
Datasheet:
Part Number:
Description:
Manufacturer:
Analog Devices Inc
Datasheet:
Part Number:
Description:
Manufacturer:
Analog Devices Inc
Datasheet:
Part Number:
Description:
Manufacturer:
Analog Devices Inc
Datasheet:
Part Number:
Description:
Manufacturer:
Analog Devices Inc
Datasheet:
Part Number:
Description:
Manufacturer:
Analog Devices Inc
Datasheet: