HFBR-1115TZ Avago Technologies US Inc., HFBR-1115TZ Datasheet - Page 11
HFBR-1115TZ
Manufacturer Part Number
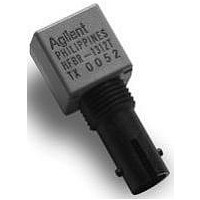
HFBR-1115TZ
Description
XMITTER MOD 1300NM 125M 16DIP ST
Manufacturer
Avago Technologies US Inc.
Datasheet
1.HFBR-1115TZ.pdf
(12 pages)
Specifications of HFBR-1115TZ
Connector Type
ST
Wavelength
1300nm
Spectral Bandwidth
137nm
Data Rate Max
0.1Gbps
Supply Voltage
5V
Wavelength Typ
1300nm
Peak Reflow Compatible (260 C)
Yes
Leaded Process Compatible
Yes
Applications
FDDI Concentrators, Bridges, Routers
Lead Free Status / RoHS Status
Lead free / RoHS Compliant
Capacitance
-
Current - Dc Forward (if)
-
Voltage - Forward (vf) Typ
-
Voltage - Dc Reverse (vr) (max)
-
Lead Free Status / RoHS Status
Lead free / RoHS Compliant, Lead free / RoHS Compliant


Notes:
10. Duty Cycle Distortion contributed by the
11. Data Dependent Jitter contributed by the
11
1. This is the maximum voltage that can be
2. The outputs are terminated with 50
3. The specified signaling rate of 10 MBd to
4. The power supply current needed to
5. This value is measured with an output load
6. This value is measured with the outputs
7. The power dissipation value is the power
8. This value is measured with respect to V
9. The output rise and fall times are
applied across the Differential Transmitter
Data Inputs to prevent damage to the input
ESD protection circuit.
connected to V
125 MBd guarantees operation of the
transmitter and receiver link to the full
conditions listed in the FDDI Physical
Layer Medium Dependent standard.
Specifically, the link bit-error-ratio will be
equal to or better than 2.5 x 10
valid FDDI pattern. The transmitter section
of the link is capable of dc to 125 MBd.
The receiver is internally ac-coupled which
limits the lower signaling rate to 10 MBd.
For purposes of definition, the symbol rate
(Baud), also called signaling rate, fs, is the
reciprocal of the symbol time. Data rate
(bits/sec) is the symbol rate divided by the
encoding factor used to encode the data
(symbols/bit).
operate the transmitter is provided to
differential ECL circuitry. This circuitry
maintains a nearly constant current flow
from the power supply. Constant current
operation helps to prevent unwanted
electrical noise from being generated and
conducted or emitted to neighboring
circuitry.
R
terminated into 50
V and an Input Optical Power level of
-14 dBm average.
dissipated in the transmitter and receiver
itself. Power dissipation is calculated as
the sum of the products of supply voltage
and currents, minus the sum of the
products of the output voltages and
currents.
with the output terminated into 50
connected to V
measured between 20% and 80% levels
with the output connected to V
through 50 .
receiver is measured at the 50% threshold
using an IDLE Line State, 125 MBd (62.5
MHz square-wave), input signal. The input
optical power level is -20 dBm average.
See Application Information–Data Link
Jitter Section for further information.
receiver is specified with the FDDI DDJ
test pattern described in the FDDI PMD
Annex A.5. The input optical power level is
-20 dBm average. See Application
Information–Data Link Jitter Section for
further information.
L
= 10 k .
CC
CC
- 2 V.
- 2 V.
connected to V
-10
CC
for any
- 2 V
CC
- 2
CC
12. Random Jitter contributed by the receiver
13. These optical power values are measured
14. The Extinction Ratio is a measure of the
15. The transmitter provides compliance with
16. This parameter complies with the FDDI
17. This parameter complies with the optical
is specified with an IDLE Line State,
125 MBd (62.5 MHz square-wave), input
signal. The input optical power level is at
the maximum of “P
Application Information–Data Link Jitter
Section for further information.
with the following conditions:
• The Beginning of Life (BOL) to the Endof
• Over the specified operating voltage and
• With HALT Line State, (12.5 MHz
• At the end of one meter of noted optical
modulation depth of the optical signal.
The data “0” output optical power is
compared to the data “1” peak output
optical power and expressed as a
percentage. With the transmitter driven by
a HALT Line State (12.5 MHz square-
wave) signal, the average optical power is
measured. The data “1” peak power is
then calculated by adding 3 dB to the
measured average optical power. The data
“0” output optical power is found by
measuring the optical power when the
transmitter is driven by a logic “0” input.
The extinction ratio is the ratio of the
optical power at the “0” level compared to
the optical power at the “1” level
expressed as a percentage or in decibels.
the need for Transmit_Disable commands
from the FDDI SMT layer by providing an
Output Optical Power level of <-45 dBm
average in response to a logic “0” input.
This specification applies to either
62.5/125 m or 50/125 m fiber cables.
PMD requirements for the tradeoffs
between center wavelength, spectral
width, and rise/fall times shown in
Figure 9.
pulse envelope from the FDDI PMD shown
in Figure 10. The optical rise and fall times
are measured from 10% to 90% when the
transmitter is driven by the FDDI HALT
Line State (12.5 MHz square-wave) input
signal.
Life (EOL) optical power degradation is
typically 1.5 dB per the industry
convention for long wavelength LEDs.
The actual degradation observed in
Avago Technologie’s 1300 nm LED
products is < 1dB, as specified in this
data sheet.
temperature ranges.
square-wave), input signal.
fiber with cladding modes removed.
The average power value can be
converted to a peak power value by
adding 3 dB. Higher output optical
power transmitters are available on
special request.
IN Min.
(W).” See
18. Duty Cycle Distortion contributed by the
19. Data Dependent Jitter contributed by the
20. Random Jitter contributed by the
21. This specification is intended to indicate
transmitter is measured at a 50% threshold
using an IDLE Line State, 125 MBd
(62.5 MHz square-wave), input signal. See
Application Information–Data Link Jitter
Performance Section of this data sheet for
further details.
transmitter is specified with the FDDI test
pattern described in FDDI PMD Annex A.5.
See Application Information–Data Link
Jitter Performance Section of this data
sheet for further details.
transmitter is specified with an IDLE Line
State, 125 MBd (62.5 MHz square-wave),
input signal. See Application Information–
Data Link Jitter Performance Section of
this data sheet for further details.
the performance of the receiver when Input
Optical Power signal characteristics are
present per the following definitions. The
Input Optical Power dynamic range from
the minimum level (with a window time-
width) to the maximum level is the range
over which the receiver is guaranteed to
provide output data with a Bit-Error-Ratio
(BER) better than or equal to 2.5 x 10
• At the Beginning of Life (BOL).
• Over the specified operating voltage and
• Input symbol pattern is the FDDI test
• Receiver data window time-width is
To test a receiver with the worst-case
FDDI PMD Active Input jitter condition
requires exacting control over DCD, DDJ,
and RJ jitter components that is difficult to
implement with production test equipment.
The receiver can be equivalently tested to
the worst-case FDDI PMD input jitter
conditions and meet the minimum output
data window time-width of 2.13 ns. This is
accomplished by using a nearly ideal input
optical signal (no DCD, insignificant DDJ
and RJ) and measuring for a wider window
time-width of 4.6 ns. This is possible due to
temperature ranges.
pattern defined in FDDI PMD Annex A.5
with 4B/5B NRZI encoded data that
contains a duty-cycle base-line wander
effect of 50 kHz. This sequence causes a
near worst-case condition for inter-
symbol interference.
2.13 ns or greater and centered at mid-
symbol. This worst-case window time-
width is the minimum allowed eye-
opening presented to the FDDI PHY
PM_Data indication input (PHY input)
per the example in FDDI PMD Annex E.
This minimum window time-width of
2.13 ns is based upon the worst-case
FDDI PMD Active Input Interface optical
conditions for peak-to-peak DCD
(1.0 ns), DDJ (1.2 ns) and RJ(0.76 ns)
presented to the receiver.
-10
.
Related parts for HFBR-1115TZ
Image
Part Number
Description
Manufacturer
Datasheet
Request
R

Part Number:
Description:
FIBER OPTIC CBL SIMPLEX 1=100M
Manufacturer:
Avago Technologies US Inc.
Datasheet:

Part Number:
Description:
FIBER OPTIC CBL SIMPLEX 1=500M
Manufacturer:
Avago Technologies US Inc.
Datasheet:

Part Number:
Description:
FIBER OPTIC CONN LATCH GRY SIMPL
Manufacturer:
Avago Technologies US Inc.
Datasheet:

Part Number:
Description:
FIBER OPTIC CONN LATCH BLU SIMPL
Manufacturer:
Avago Technologies US Inc.
Datasheet:

Part Number:
Description:
XMITTER VERSATILE LINK HORZ
Manufacturer:
Avago Technologies US Inc.
Datasheet:

Part Number:
Description:
Fiber Optic Transmitters, Receivers, Transceivers 1300nm 155MBd 16-pin DIP ST Rx
Manufacturer:
Avago Technologies US Inc.

Part Number:
Description:
FIBER OPTIC CBL DUPLEX 1=100M
Manufacturer:
Avago Technologies US Inc.
Datasheet:
Part Number:
Description:
FIBER OPTIC CBL SIMPLEX 1=500M
Manufacturer:
Avago Technologies US Inc.
Datasheet:
Part Number:
Description:
FIBER OPTIC CBL DUPLEX 1=500M
Manufacturer:
Avago Technologies US Inc.
Datasheet:

Part Number:
Description:
FIBER OPTIC CBL SIMPLEX 1=100M
Manufacturer:
Avago Technologies US Inc.
Datasheet:

Part Number:
Description:
OPTOCOUPLER GATE DRV 2A 16-SOIC
Manufacturer:
Avago Technologies US Inc.
Datasheet:
Part Number:
Description:
OPTOCOUPLER 2CH 2.5A 16-SOIC
Manufacturer:
Avago Technologies US Inc.
Datasheet:

Part Number:
Description:
OPTOCOUPLER GATE DRV 0.4A 16SOIC
Manufacturer:
Avago Technologies US Inc.
Datasheet:

Part Number:
Description:
OPTOCOUPLER 2.0A 250KHZ 8-DIP
Manufacturer:
Avago Technologies US Inc.
Datasheet:

Part Number:
Description:
OPTOCOUPLER 2.0A 250KHZ GW 8-SMD
Manufacturer:
Avago Technologies US Inc.
Datasheet: