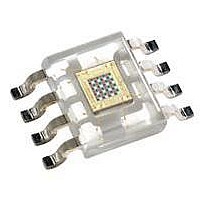
TCS3210D-TR TAOS, TCS3210D-TR Datasheet - Page 8

TCS3210D-TR
Manufacturer Part Number
TCS3210D-TR
Description
Photodiodes TriColor Sensor LTF Low Sensitivity
Manufacturer
TAOS
Type
Light to Frequency Converterr
Datasheet
1.TCS3200D-TR.pdf
(14 pages)
Specifications of TCS3210D-TR
Peak Wavelength
470 nm to 640 nm
Maximum Light Current
2 mA
Maximum Dark Current
0.1 uA
Package / Case
SOIC-8
Lead Free Status / RoHS Status
Lead free / RoHS Compliant
Available stocks
Company
Part Number
Manufacturer
Quantity
Price
Company:
Part Number:
TCS3210D-TR
Manufacturer:
TAOS
Quantity:
1 791
TCS3200, TCS3210
PROGRAMMABLE
COLOR LIGHT-TO-FREQUENCY CONVERTER
TAOS099 − JULY 2009
Measuring the frequency
PCB Pad Layout
NOTES: A. All linear dimensions are in millimeters.
8
Copyright E 2009, TAOS Inc.
The choice of interface and measurement technique depends on the desired resolution and data acquisition
rate. For maximum data-acquisition rate, period-measurement techniques are used.
Output data can be collected at a rate of twice the output frequency or one data point every microsecond for
full-scale output. Period measurement requires the use of a fast reference clock with available resolution directly
related to reference clock rate. Output scaling can be used to increase the resolution for a given clock rate or
to maximize resolution as the light input changes. Period measurement is used to measure rapidly varying light
levels or to make a very fast measurement of a constant light source.
Maximum resolution and accuracy may be obtained using frequency-measurement, pulse-accumulation, or
integration techniques. Frequency measurements provide the added benefit of averaging out random- or
high-frequency variations (jitter) resulting from noise in the light signal. Resolution is limited mainly by available
counter registers and allowable measurement time. Frequency measurement is well suited for slowly varying
or constant light levels and for reading average light levels over short periods of time. Integration (the
accumulation of pulses over a very long period of time) can be used to measure exposure, the amount of light
present in an area over a given time period.
Suggested PCB pad layout guidelines for the D package are shown in Figure 6.
B. This drawing is subject to change without notice.
Figure 6. Suggested D Package PCB Layout
1.27
4.65
APPLICATION INFORMATION
r
www.taosinc.com
0.50
2.25
6.90
r
The LUMENOLOGY r Company


