FLUKE-1743-60HZ Fluke, FLUKE-1743-60HZ Datasheet - Page 3
FLUKE-1743-60HZ
Manufacturer Part Number
FLUKE-1743-60HZ
Description
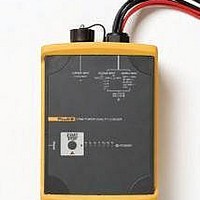
Datalogging & Acquisition POWER QUALITY LOGGER MEMOBOX
Manufacturer
Fluke
Datasheet
1.FLUKE-1743-60HZ.pdf
(7 pages)
Specifications of FLUKE-1743-60HZ
Lead Free Status / RoHS Status
Lead free / RoHS Compliant
Other names
2583446


Measure all power quality and power
parameters
The Fluke 1745 and Fluke 1744 log over 500
different parameters for each averaging period. This
allows you to analyze power quality in detail and
to correlate intermittent events, helping to identify
the root cause of disturbances. For basic power
logging, the Fluke 1743 captures all relevant power
parameters.
Calculates current harmonics
Fluke 1745 and Fluke 1744 loggers can calculate
the limits of current harmonics to predict overload
of the grid according to the standards VSE, VEOE,
VDN, among others. This powerful predictive main-
tenance feature enables current harmonics to be
observed before a distortion appears in the voltage.
3 Fluke Corporation 1740 Series Three-Phase Power Quality Loggers Memobox
View graphs and generate reports
with Fluke PQ Log software
With its easy-to-use interface, the included PQ Log
software assists you with logger setup, enables
you to verify actual measurement values quickly
using the online function, and downloads data
from the logger to a connected PC operating on
standard Windows
view the logged data in graphical and tabular
form, export it to a spreadsheet, or generate a pro-
fessional report with the Report Writer function.
Statistical summaries like EN50160 and DISDIP table provide a quick,
comprehensive summary. The EN50160 overview display provides a simple
display of 8 power quality parameters on one dashboard, according to the latest
international power quality standard.
®
operating systems. You can
For root cause analysis, different measurements such as
flicker, voltage and THD can be shown in the same time
plot, helping to quickly identify the cause of a disturbance.
Statistical analysis of Voltage and Current harmonics over a
given time period. Red bar graphs indicate issues with the
grid. Other colors are warnings for pontential future issues.
Harmonics can be presented also as time plots.