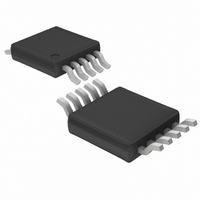
LTC2411-1CMS#PBF Linear Technology, LTC2411-1CMS#PBF Datasheet - Page 32

LTC2411-1CMS#PBF
Manufacturer Part Number
LTC2411-1CMS#PBF
Description
IC A/DCONV DIFF INPUT&REF 10MSOP
Manufacturer
Linear Technology
Datasheet
1.LTC2411CMSPBF.pdf
(40 pages)
Specifications of LTC2411-1CMS#PBF
Number Of Bits
24
Sampling Rate (per Second)
6.8
Data Interface
MICROWIRE™, Serial, SPI™
Number Of Converters
2
Power Dissipation (max)
1mW
Voltage Supply Source
Single Supply
Operating Temperature
0°C ~ 70°C
Mounting Type
Surface Mount
Package / Case
10-TFSOP, 10-MSOP (0.118", 3.00mm Width)
Lead Free Status / RoHS Status
Lead free / RoHS Compliant
Available stocks
Company
Part Number
Manufacturer
Quantity
Price
APPLICATIO S I FOR ATIO
LTC2411/LTC2411-1
up to 150% of full scale. In many industrial applications,
it is not uncommon to have to measure microvolt level
signals superimposed over volt level perturbations and
LTC2411/LTC2411-1 are eminently suited for such tasks.
When the perturbation is differential, the specification of
interest is the normal mode rejection for large input signal
levels. With a reference voltage V
LTC2411-1 have a full-scale differential input range of 5V
peak-to-peak. Figures 37 and 38 show measurement re-
sults for the LTC2411 normal mode rejection ratio with a
7.5V peak-to-peak (150% of full scale) input signal super-
imposed over the more traditional normal mode rejection
ratio results obtained with a 5V peak-to-peak (full scale)
input signal and Figure 39 shows the corresponding mea-
surement result for the LTC2411-1. It is clear that the
LTC2411/LTC2411-1 rejection performance is maintained
with no compromises in this extreme situation. When op-
erating with large input signal levels, the user must ob-
serve that such signals do not violate the device absolute
maximum ratings.
BRIDGE APPLICATIONS
Typical strain gauge based bridges deliver only 2mV/Volt
of excitation. As the maximum reference voltage of the
LTC2411/LTC2411-1 is 5V, remote sensing of applied
excitation without additional circuitry requires that excita-
tion be limited to 5V. This gives only 10mV full scale, which
can be resolved to 1 part in 5000 without averaging. For
many solid state sensors, this is comparable to the sensor.
32
–100
–120
– 60
–20
–40
–80
0
0
20
Figure 36. Input Normal Mode Rejection
vs Input Frequency (LTC2411-1)
40
U
60
INPUT FREQUENCY (Hz)
80
U
100
MEASURED DATA
CALCULATED DATA
120
REF
W
140 160
= 5V, the LTC2411/
180
V
V
REF
V
V
F
T
O
A
CC
REF
INCM
IN(P-P)
U
= GND
= 25 C
–
= 5V
= 5V
= GND
200
= 2.5V
= 5V
2411 F36
220
–100
–120
–100
–120
–100
–120
– 60
–20
–40
–80
–20
–40
– 60
–80
–20
–40
– 60
–80
0
0
0
0
0
0
Figure 37. Measured Input Normal Mode Rejection
vs Input Frequency (LTC2411)
Figure 38. Measured Input Normal Mode Rejection
vs Input Frequency (LTC2411)
Figure 39. Measured Input Normal Mode Rejection
vs Input Frequency (LTC2411-1)
15 30 45 60 75 90 105 120 135 150 165 180 195 210 225 240
20
25
40
50
60
INPUT FREQUENCY (Hz)
INPUT FREQUENCY (Hz)
INPUT FREQUENCY (Hz)
80
75
V
V
(150% OF FULL SCALE)
IN(P-P)
IN(P-P)
V
V
(150% OF FULL SCALE)
V
V
(150% OF FULL SCALE)
IN(P-P)
IN(P-P)
IN(P-P)
IN(P-P)
100
100
= 5V
= 7.5V
= 5V
= 7.5V
= 5V
= 7.5V
120
125
140 160
150
V
V
V
F
T
180
V
V
REF
V
F
T
V
V
V
F
T
O
A
CC
REF
INCM
O
A
O
A
CC
REF
INCM
CC
REF
INCM
= 5V
= 25 C
175
= GND
= 25 C
= GND
= 25 C
= 5V
–
= 5V
= 5V
= 5V
= 5V
= 5V
= GND
200
= 2.5V
= 2.5V
= 2.5V
2411 F38
2411 F37
2411 F39
200
220


