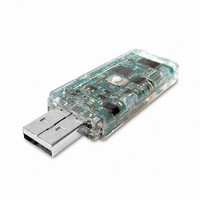
VR001 Mide Technology Corporation, VR001 Datasheet - Page 10

VR001
Manufacturer Part Number
VR001
Description
VIBRATION DATA LOGGER
Manufacturer
Mide Technology Corporation
Series
Slam Stick™, Volture™r
Specifications of VR001
Featured Product
Slam Stick⢠Vibration Recorder
Accessory Type
Vibration Characterization Device
Lead Free Status / Rohs Status
Lead free by exemption / RoHS compliant by exemption
For Use With/related Products
Volture™ Vibration Energy Harvesters
For Use With
V25W - PIEZOELECTRIC ENERGY HARVESTERV20W - PIEZOELECTRIC ENERGY HARVESTERV21BL - PIEZOELECTRIC ENERGY HARVESTERV21B - PIEZOELECTRIC ENERGY HARVESTERV22BL - PIEZOELECTRIC ENERGY HARVESTERV22B - PIEZOELECTRIC ENERGY HARVESTER
create_axis_controls(self) – Creates plot‐specific axis controls. The default
create_axis_controls, for line plots, creates checkboxes to switch between linear and logarithmic
axis scales. For other plot types, this method should be overridden.
update(self) – Fully updates the plot window, including rescaling of the axes. This method
should be called after changing or adding new data to a plot.
redraw(self) – Redraws the current plot window, but does not recompute axis scale (much
faster than a full update). This method should be called after making minor changes to a plot,
such as changing plot element colors or visibility, which do not affect the required axis limits.
Notably absent from the base ssplot class is a ‘plot(…)’ method. An appropriate plot(…)
method must be explicitly provided by the subclass. In most cases this plot method will accept an
array containing the data to be plotted (plus any other needed arguments), and in turn call the
appropriate matplotlib plotting functions on the class instance’s Axes (named self.myplot).
For example, the existing line‐based plotting methods call self.myplot.plot(…), and
spectrogram plotting calls self.myplot.specgram(…), etc.
With the appropriate ssplot subclass, the complete steps to add a plot to the GUI are:
Python Graphing UI
In the main script (slamview.py), instantiate your custom plot and add it to the
‘notebook’ (tabbed window):
yourFrame = yourPlotType(tabsFrame, root)
The plot window (plus its controls, etc.) and its corresponding tab will be added to the
main window.
In the main script’s populate_window() function, add the appropriate
yourPlotType.plot(…) call:
yourFrame.plot(datalist, args)
To keep the main script uncluttered, it is recommended for plot methods to accept the
existing time‐domain recording data (datalist[…]) and perform any necessary
calculations internally.
|
Version 1.1
|
Slam Stick High Speed Portable Data Logger
|
PYTHON GRAPHIC UI
www.mide.com
10


