ULINKPRO Keil, ULINKPRO Datasheet - Page 68
ULINKPRO
Manufacturer Part Number
ULINKPRO
Description
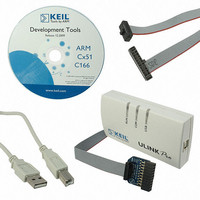
KIT DEBUG/TRACE UNIT HIGH SPEED
Manufacturer
Keil
Type
In-Circuit, Real-Time Debugger/Programmerr
Specifications of ULINKPRO
Contents
Module
For Use With/related Products
ARM7, ARM9, Cortex
Lead Free Status / RoHS Status
Lead free / RoHS Compliant


Getting Started: Creating Applications with µVision
67
Performance Analyzer – displays, in graphical form, the time consumed
by modules and functions as well as the number of function calls
Code Coverage – dialog to view code execution statistics in a different
way than with the Performance Analyzer
System Viewer – view the values of your Peripheral Registers
Instruction Trace – displays/hides the Instruction Trace Window
Toolbox – shows/hides the Toolbox dialog. Depending on your target
system, various options are available.
Debug Restore Views – drop-down to select the preferred window layout
while debugging
Additional Icons
Print – opens the printer dialog
Books – opens the Books Window in the Project Workspace
Functions – opens the Functions Window in the Project Workspace
Templates – opens the Templates Window in the Project Workspace
Source Browser – opens the Source Browser Window in the Output
Workspace. Use this feature to find definitions or occurrences of
variables, functions, modules, and macros in your code.
µVision Help – opens the µVision Help Browser
File – Source file; you can modify these files; default options are used
File – Source file; you can modify these files; file options have been
changed and are different from the default options
File or Module – header files; normally, included automatically into the
project; options cannot be set for these file types
Related parts for ULINKPRO
Image
Part Number
Description
Manufacturer
Datasheet
Request
R

Part Number:
Description:
MCU, MPU & DSP Development Tools USB-JTAG Adapter
Manufacturer:
Keil Tools

Part Number:
Description:
KEIL C-COMPILER INTERNATIONAL
Manufacturer:
Silicon Laboratories Inc
Part Number:
Description:
KEIL C-COMPILER US VERSION
Manufacturer:
Silicon Laboratories Inc

Part Number:
Description:
DEV KIT FOR STM32
Manufacturer:
STMicroelectronics
Datasheet:

Part Number:
Description:
KIT STARTER FOR STM32
Manufacturer:
STMicroelectronics
Datasheet:

Part Number:
Description:
KIT STARTER FOR STM32F10XE MCU
Manufacturer:
STMicroelectronics
Datasheet:

Part Number:
Description:
KIT STARTER KEIL FOR STR910
Manufacturer:
STMicroelectronics
Datasheet:


Part Number:
Description:
Microcontroller Modules & Accessories KEIL ULINK PRO 5V ADAPTOR KIT
Manufacturer:
Keil Software
Part Number:
Description:
Development Boards & Kits - ARM KEIL NUVOTON EVAL BD CORTEX-M0 + ULINK-ME
Manufacturer:
Keil Tools
Datasheet:
Part Number:
Description:
Development Boards & Kits - ARM KEIL NUVOTON EVAL BD CORTEX-M0
Manufacturer:
Keil Tools
Datasheet:

Part Number:
Description:
BOARD EVAL FOR LPC213X ARM MCU
Manufacturer:
NXP Semiconductors
Datasheet:

Part Number:
Description:
K60N512 Keil Tower Kit
Manufacturer:
Freescale Semiconductor
Datasheet: