ULINKPRO Keil, ULINKPRO Datasheet - Page 3
ULINKPRO
Manufacturer Part Number
ULINKPRO
Description
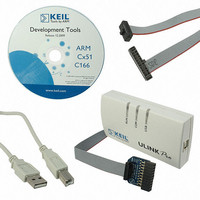
KIT DEBUG/TRACE UNIT HIGH SPEED
Manufacturer
Keil
Type
In-Circuit, Real-Time Debugger/Programmerr
Specifications of ULINKPRO
Contents
Module
For Use With/related Products
ARM7, ARM9, Cortex
Lead Free Status / RoHS Status
Lead free / RoHS Compliant


µVision Debugger
The µVision Debugger can be configured as a Target Debugger
or as a Simulator. It provides a single environment in which you
may test, verify, and optimize your application.
The Debugger also simulates many ARM-Powered MCUs
including their instruction set and on-chip peripherals.
Debug Windows
The Debugger provides windows and dialogs to help you
monitor and control your system. These include:
ULINK Debug Adapters
The ULINK family of USB Debug Adapters connect your
PC's USB port to your target system (via JTAG or SWD),
allowing you to debug and analyze embedded programs
running on target hardware.
The ULINKpro provides unique streaming trace directly to
your PC, enabling advanced analysis of your applications such
as Execution Profiling and Code Coverage.
Memory Window - review and modify memory contents.
Watch Window - view and modify program variables and
lists the current function call nesting.
Symbol Window - view debug symbol information of the
application program.
Disassembly Window - synchronized with the Source
Windows making program debugging easier.
Register Window - view and change register contents.
Call Stack Window - view current call nesting including
variable values.
Breakpoints Window - define watchpoints and complex
Execution, Access, and Conditional breakpoints.
Browse Window - search for objects in your code.
Visit:
System Viewer
The System Viewer windows display peripheral registers that
the processor can read and write to. They display the state,
content, and name of peripheral registers. Content values are
instantly updated by the target hardware as changes occur.
Values can also be changed at run-time by typing a new value
from within the System Viewer window.
Analysis Tools
The advanced analysis tools work with the simulator or with
target hardware via the ULINKpro streaming trace adapter.
The configurable Logic Analyzer provides a graphical display
of signals and variables. You may click on variable changes to
display the instructions that caused that change in the source
code editor window.
The Debugger provides Code Coverage statistics to verify
applications that require certification testing and validation.
Color coding highlights the execution status of instructions
helping you to refine your testing.
The Performance Analyzer displays the execution time
recorded for functions in your application. Bar graphs display
the time spent in a function, and the number of calls to it.
The Execution Profiler records execution statistics for each
CPU instruction, including the execution count and execution
time for each instruction. These can be reviewed in the editor
and disassembler windows.
Features
Performance
Analysis Tools
Run control debug
Memory + Breakpoint
Data Trace
Instruction Trace
JTAG Clock speed
Memory read/write
Data Trace streaming
Data Trace streaming
ETM Trace streaming
Logic Analyzer
Performance Analyzer
Execution Profiler
Code Coverage
www.keil.com/ULINK
(Cortex-M3/M4)
MDK-ARM Microcontroller Development Kit
(Cortex-M3/M4)
(ARM & Cortex-M)
(UART mode)
(Manchester mode)
(while running)
ULINKpro
100Mbit/s
800Mbit/s
1MByte/s
50MHz
Yes
Yes
Yes
Yes
Yes
Yes
Yes
Yes
-
25KByte/s
ULINK2
1Mbit/s
10MHz
Yes
Yes
Yes
Yes
-
-
-
-
-
-
3
Related parts for ULINKPRO
Image
Part Number
Description
Manufacturer
Datasheet
Request
R

Part Number:
Description:
MCU, MPU & DSP Development Tools USB-JTAG Adapter
Manufacturer:
Keil Tools

Part Number:
Description:
KEIL C-COMPILER INTERNATIONAL
Manufacturer:
Silicon Laboratories Inc
Part Number:
Description:
KEIL C-COMPILER US VERSION
Manufacturer:
Silicon Laboratories Inc

Part Number:
Description:
DEV KIT FOR STM32
Manufacturer:
STMicroelectronics
Datasheet:

Part Number:
Description:
KIT STARTER FOR STM32
Manufacturer:
STMicroelectronics
Datasheet:

Part Number:
Description:
KIT STARTER FOR STM32F10XE MCU
Manufacturer:
STMicroelectronics
Datasheet:

Part Number:
Description:
KIT STARTER KEIL FOR STR910
Manufacturer:
STMicroelectronics
Datasheet:


Part Number:
Description:
Microcontroller Modules & Accessories KEIL ULINK PRO 5V ADAPTOR KIT
Manufacturer:
Keil Software
Part Number:
Description:
Development Boards & Kits - ARM KEIL NUVOTON EVAL BD CORTEX-M0 + ULINK-ME
Manufacturer:
Keil Tools
Datasheet:
Part Number:
Description:
Development Boards & Kits - ARM KEIL NUVOTON EVAL BD CORTEX-M0
Manufacturer:
Keil Tools
Datasheet:

Part Number:
Description:
BOARD EVAL FOR LPC213X ARM MCU
Manufacturer:
NXP Semiconductors
Datasheet:

Part Number:
Description:
K60N512 Keil Tower Kit
Manufacturer:
Freescale Semiconductor
Datasheet: