ICE4000 Microchip Technology, ICE4000 Datasheet - Page 27
ICE4000
Manufacturer Part Number
ICE4000
Description
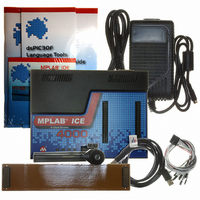
EMULATOR MPLAB-ICE 4000 POD
Manufacturer
Microchip Technology
Series
MPLAB® ICE 4000r
Type
Microcontrollerr
Datasheet
1.ICE4000.pdf
(98 pages)
Specifications of ICE4000
Contents
ICE4000 POD, Parallel and USB Cable, Power Supply, MPLAB IDE CD and Documentation
Interface Type
USB
Lead Free Status / RoHS Status
Contains lead / RoHS non-compliant
For Use With/related Products
dsPIC30F & PIC18 Series
Lead Free Status / Rohs Status
Lead free / RoHS Compliant


4.1
4.2
4.3
2004 Microchip Technology Inc.
INTRODUCTION
HIGHLIGHTS
STARTING AND STOPPING EMULATION
MPLAB ICE 4000 provides a wide variety of tools to emulate and debug an application.
MPLAB ICE 4000 offers a basic set of in-circuit debugging tools, including the ability to
run, halt, reset and single step the processor, plus additional tools for advanced
debugging techniques.
Several basic MPLAB ICE 4000 emulator features are built-in to the MPLAB IDE
software. A general description of these features is provided here, but for more detailed
information, consult the MPLAB IDE documentation.
Other basic tools appear when MPLAB ICE 4000 is selected as the debug tool.
MPLAB ICE 4000 basic features include the following:
• Starting and Stopping Emulation
• Viewing Processor Memory and Files
• Using Software Breakpoints
• Using Hardware Breakpoints
• Using Trigger In/Out Settings
• Using a Real-Time Watch
• Using the Stopwatch
• Monitoring Emulator States and Operations
To debug an application in MPLAB IDE, you must either build your source code into an
executable file using projects and work spaces (see MPLAB IDE on-line help for more
information) or you must import an existing executable file using File>Import. Once you
have your application in executable form, you may run, halt, step through or reset your
code.
• To run your code, select either Debugger>Run or Run from the Debug toolbar.
• To halt your code, select either Debugger>Halt or Halt from the Debug toolbar.
• To step through your code, select either Debugger>Step Into or Step Into from
• To step over a line of code, select either Debugger>Step Over or Step Over from
• To repeatedly step through your code, select either Debugger>Animate or
the Debug toolbar. Be careful not to step into a Sleep instruction or you will have
to perform a processor reset to resume emulation.
the Debug toolbar.
Animate from the Debug toolbar.
Note: You cannot step through external memory high-level language code in
Chapter 4. Basic Features
the Program Memory or File window. Use the Disassembly window.
MPLAB
USER’S GUIDE
®
ICE 4000
DS51490A-page 21
Related parts for ICE4000
Image
Part Number
Description
Manufacturer
Datasheet
Request
R

Part Number:
Description:
IC USB FOR USB2WIGGLER 14PIN
Manufacturer:
Macraigor Systems LLC
Part Number:
Description:
IC USB FOR USB2DEMOM 14PIN
Manufacturer:
Macraigor Systems LLC
Datasheet:

Part Number:
Description:
Manufacturer:
Microchip Technology Inc.
Datasheet:
Part Number:
Description:
Manufacturer:
Microchip Technology Inc.
Datasheet:
Part Number:
Description:
Manufacturer:
Microchip Technology Inc.
Datasheet:
Part Number:
Description:
Manufacturer:
Microchip Technology Inc.
Datasheet:
Part Number:
Description:
Manufacturer:
Microchip Technology Inc.
Datasheet:
Part Number:
Description:
Manufacturer:
Microchip Technology Inc.
Datasheet:
Part Number:
Description:
Manufacturer:
Microchip Technology Inc.
Datasheet:
Part Number:
Description:
Manufacturer:
Microchip Technology Inc.
Datasheet: