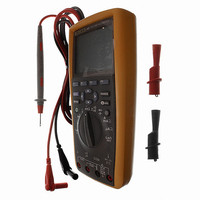
FLUKE-289 Fluke Electronics, FLUKE-289 Datasheet - Page 60

FLUKE-289
Manufacturer Part Number
FLUKE-289
Description
DMM TRUE RMS 50000CNT W/BCKLGHT
Manufacturer
Fluke Electronics
Series
28xr
Type
Digital (DMM)r
Datasheet
1.FLUKE-289.pdf
(88 pages)
Specifications of FLUKE-289
Includes
Battery, Clips, Test Leads
Style
Handheld
Display Digits
4.5
Display Type
LCD, Bar Graph
Display Count
50000
Function
Voltage, Current, Resistance, Capacitance, Temperature, Frequency
Functions, Extra
Continuity, dB
Features
Data Logging, Hold, Memory, Min/Max/Ave
Ranging
Auto/Manual
Response
True RMS
Lead Free Status / RoHS Status
Not applicable / RoHS non-compliant
Other names
289
614-1062
614-1062
287/289
Users Manual
saved under the name of Save-2. The auto-incrementing number
can be reset to 1 by positioning the menu selector next to the
save name and then pressing the softkey labeled Reset #.
To save a screen shot, a recording session, or MIN MAX or Peak
record session, press the softkey labeled Save. To select the
name from the preset list, press +Name. To save to the same
name as before but with the next number, press the softkey
labeled Save. This second method makes it easy to save a
series of measurements simply by pressing the Save softkey
twice for each save operation.
When selecting the name for a save operation, position the menu
selector next to the desired name using the cursor buttons. Next
press the softkey labeled Save.
Viewing Memory Data
Viewing data stored in the Meter’s memory is performed through
the save menu. Press the softkey labeled Save. Position the
menu selector next to the menu item labeled View Memory and
press the softkey labeled View.
The Meter separates stored data into four different categories:
Measurement, MIN MAX, Peak, and Recording. Use the cursor
buttons to position the menu selector next to the desired saved
data category and then press the softkey labeled View. The
Meter displays the last record saved for the selected data
category.
50
To view data stored in memory, the Meter must not be
recording or performing a MIN MAX or peak record
session.
Note
If there are previously stored records, press the softkey labeled
Prev or 5 to page back through previously stored records. Press
the softkey labeled Next or 6 to page in the other direction. Press
Close to return to normal Meter operation.
Viewing Snapshot and Summary Data
After selecting the MIN MAX, Peak, or Measurement category
described in the Viewing Memory Data section above, pressing
View only displays the information stored at the time a Save was
performed. The display is reconstructed from this data when
viewed.
Viewing Trend Data
For the Recording category, the interval and event data stored
during a recording session are viewed on the Meter through a
trend-plot view, similar to a strip-chart recorder. See the
“Recording Measurement Data” section later in this manual for
an explanation of interval and event data.
After selecting the recording category described in the Viewing
Memory Data section above and pressing View, the recording
session’s summary screen is displayed (See Table 9). Press the
softkey labeled Trend to display the recorded data in a trend-plot
view. Table 7 shows the trend view along with a description of
each of its components.
To look at data stored in the individual records that make up the
trend, move the cursor to any point along the plot by pressing 6
or 5. The value and timestamp of the minimum, maximum, and
end-of-record values of the selected record are displayed at the
bottom of the cursor. All data contained in a record can only be
viewed on a PC running FlukeView Forms.


