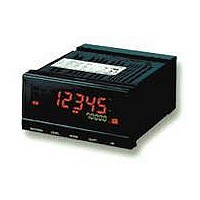
K3HB-XVD 100-240VAC Omron, K3HB-XVD 100-240VAC Datasheet - Page 29

K3HB-XVD 100-240VAC
Manufacturer Part Number
K3HB-XVD 100-240VAC
Description
PROCESS INDICATR DC VOLTAG INPUT
Manufacturer
Omron
Series
K3HBr
Type
Process Meterr
Datasheet
1.K33-B.pdf
(36 pages)
Specifications of K3HB-XVD 100-240VAC
Measuring Range
0 ~ 199.99V
Display Style
Green, Red Characters, Black Background
Display Type
LCD
Display Face Size
3.78" L x 1.89" W (96.0 x 48.0mm)
Display Digits
5
Display Digits - Height
0.193" (4.90mm), 0.559" (14.20mm)
Backlight
Green, Red
Mounting Type
Panel Mount
Termination
Screw Terminals
Voltage - Supply
100 ~ 240VAC
Lead Free Status / RoHS Status
Lead free / RoHS Compliant
Other names
K3HB-XVD100-240VAC
K3HBXVD100240VAC
K3HBXVD100240VAC
■ Main Functions
Measurement
• Two input circuits are provided. The input ranges for these circuits
• In addition to calculations such as K (constant)–A (input for one cir-
Normal
• Continuously performs measurement and always outputs based on
Peak Hold/Bottom Hold
• Measures the maximum (or minimum) value in a specified period.
Scaling converts input signals in any way required before displaying
them. The values can be manipulated by shifting, inverting, or +/–
reversing.
Settings for scaling can be made using the present measurement
values instead of inputting values with the SHIFT and UP Keys. This
is a convenient function for making the settings while monitoring the
operating status.
Turns the comparative output OFF until the measurement value
enters the PASS range.
B-36
Display value 2
Display value 1
Input Calculation
Timing Hold
H comparative set value
Scaling
Teaching
Standby Sequence
Measurement value
Display value
can be set independently. For example, one can be set to 4 to 20
mA and the other can be set to 1 to 5 V.
cuit), it is possible to perform calculations based on the inputs for
both circuits, such as A+B and A–B, making it possible to perform
thickness measurement and level-difference measurement using
displacement and length-measuring sensors.
comparative results.
Measurement value
(dsp.a2)
(dsp.a1)
TIMING
input
OFF
Input
H output
ON
Input value 1
(inp.a1)
Panel Meter Series
Input
(Scaling)
Input value 2
(inp.a2)
Input value
Display value 2
Display value 1
Display value
(dsp.a2)
(dsp.a1)
K3HB
S
X V H S
X V S
X V S
X V H S
Input value 2
(inp.a2)
(Reverse scaling)
Peak hold value
Input value 1
Bottom hold value
(inp.a1)
Time
Time
Input value
Sampling Hold
• Holds the measurement at the rising edge of the TIMING signal.
Peak-to-peak Hold
• Measures the difference between the maximum and minimum val-
Average Processing
Average processing of input signals with extreme changes or noise
smooths out the display and makes control stable.
Slight changes can be removed from input signals to detect only
extreme changes.
Shifts the temperature input value.
Previous Average Value Comparison
Temperature Input Shift
Measurement value
K
ues in a specified period.
Supported Models
The models that support the functions shown here are indi-
cated by symbols as follows:
Measurement value
X
V
H
S
TIMING
TIMING
K3HB-X
K3HB-V
K3HB-H
K3HB-S
input
A
input
OFF
OFF
Input
Input
ON
ON
a1
K−A
b1
(b1−a1)
'a2
X V H S
X V H S
H
'b2
Sampling hold value
Peak-to-peak value
(b2−a2)
Time
Time


