U2001A AGILENT TECHNOLOGIES, U2001A Datasheet - Page 19
U2001A
Manufacturer Part Number
U2001A
Description
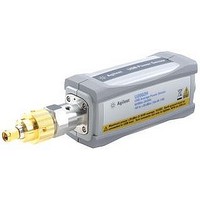
USB POWER SENSOR, 6GHZ, -60DBM To +20DBM
Manufacturer
AGILENT TECHNOLOGIES
Datasheet
1.U2001A.pdf
(23 pages)
Specifications of U2001A
Frequency Measuring Range
10MHz To 6GHz
Amplitude Accuracy
± 3%
Standing Wave Ratio
1.19
Connector Type
N
External Height
35.9mm
External Width
46mm
External Depth
163.75mm
Lead Free Status / RoHS Status
na


Using the U2000 Series with the N1918A Power Analysis Manager
(continued)
(continued)
2. Recording time for trace graphs may vary based on trace graph settings
Display units:
Absolute: Watts or dBm
Relative: Percent or dB
Display resolution:
Resolution of 1.0, 0.1, 0.01 and 0.001
dB in log mode; one to four digits in
linear mode
Default resolution:
0.01 dB in log mode; three digits in
linear mode
Zero:
For performing internal and external
zeroing
Range:
Sensor-dependent, configurable in
1-kHz steps
Save/Load file functions
Save measurement data (with
timestamp)
Load measurement data
Data recording
Instrument settings options
Save and restore instrument setting
Time-gated measurements
Instrument preset settings
FDO table parameters
Measurement limit and alert functions
Limit and alert notification
Alert summary
Support function
Print application screen
2
(with timestamp)
Power panel (basic)
√ (applies to strip chart display; up to 10,000
data points)
√ (applicable in Strip Chart and Trace Graph)
X
√
√
√
√
X
X
√
Relative:
Displays all successive measure-
ments relative to the last referenced
value
Offset:
Allows power measurements to be
offset by –100 dB to +100 dB, con-
figurable in 0.001 dB increments, to
compensate for external loss or gain
Duty cycle:
Duty cycle values between 0.001% to
99.999% can be entered in increments
of 0.01% to display a pulse power
representation of measured power.
The following equation is used to
calculate the displayed pulse power
value: Pulse Power = Measured
Power/Duty Cycle
19
Power analyzer (advanced)
√ (applicable in Strip Chart and Trace Graph)
√ (applicable in Strip Chart and Trace Graph)
√ (applicable in Trace Graph
Chart, and Gauge)
√
√
√
√
√
√
√
Limits:
High and low limits can be set in
the range between –150.00 dBm
to +230.000 dBm, in 0.001 dBm
increments
Preset default values:
Channel Offset (dB) = 0, Duty Cycle
Off, Frequency 50 MHz, AUTO
Average, AUTO Range, Free Run
Mode, dBm mode
2
, Soft Panel, Strip