MCP3909-I/SS Microchip Technology, MCP3909-I/SS Datasheet - Page 81
MCP3909-I/SS
Manufacturer Part Number
MCP3909-I/SS
Description
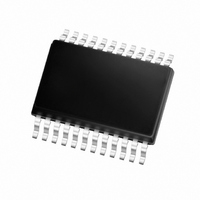
IC POWER METERING-1 PHASE 24SSOP
Manufacturer
Microchip Technology
Datasheets
1.MCP3909T-ISS.pdf
(44 pages)
2.MCP3909T-ISS.pdf
(104 pages)
3.MCP3909-ISS.pdf
(40 pages)
Specifications of MCP3909-I/SS
Package / Case
24-SSOP (0.200", 5.30mm Width)
Input Impedance
390 KOhm
Measurement Error
0.1%
Voltage - I/o High
2.4V
Voltage - I/o Low
0.85V
Current - Supply
2.3mA
Voltage - Supply
4.5 V ~ 5.5 V
Operating Temperature
-40°C ~ 85°C
Mounting Type
Surface Mount
Meter Type
Single Phase
Operating Temperature Range
- 40 C to + 85 C
Mounting Style
SMD/SMT
Supply Voltage Range
4.5V To 5.5V
Digital Ic Case Style
SSOP
No. Of Pins
24
Interface Type
Serial, SPI
Supply Voltage Max
5.5V
Rohs Compliant
Yes
Lead Free Status / RoHS Status
Lead free / RoHS Compliant
For Use With
MCP3909EV-MCU16 - EVALUATION BOARD FOR MCP3909MCP3909RD-3PH1 - REF DESIGN MCP3909 3PH ENGY MTR
Lead Free Status / Rohs Status
Lead free / RoHS Compliant
Available stocks
Company
Part Number
Manufacturer
Quantity
Price

Part Number:
MCP3909-I/SS
Manufacturer:
MICROCHIP/微芯
Quantity:
20 000


© 2009 Microchip Technology Inc.
Where:
EQUATION C-10:
Equation C-10 is called the quasi-synchronous window function. After determining the
sampling points, the number of iterations and numerical quadrature method, the
coefficients of quasi-synchronous window function will become definite, and a
quasi-synchronous window function arrays may be established in advance.
Using the quasi-synchronous window function to carry out the weighted process of the
original data is equivalent to carrying out data synchronization one time, and the
algorithm realization is also very simple that only a multiplication of the original data and
quasi-synchronous window function arrays is required. After processing, the new
periodic signal will have the same period and frequency components as the original
signal, and the synchronization error of the new signal becomes smaller.
Figure C-3 is a schematic of the quasi-synchronous window function characteristics in
the time domain and data processing. In Figure C-3, the red curve is the characteristic
of the window function, and the blue curve is input signal, and the green curve is the
output signal.
FIGURE C-3:
Processing.
Window function
Raw data
Data processed
Quasi-Synchronous Window Function Characteristics Curve and Data
Sampling point (1-193) Time 3.2 ksps
R
i
=
----- -
N
1
n
Power Calculation Theory
⋅
η
i
(
i = 0 ~ n x N
)
DS51723A-page 81
Related parts for MCP3909-I/SS
Image
Part Number
Description
Manufacturer
Datasheet
Request
R

Part Number:
Description:
Energy Metering IC with SPI Interface and Active Power Pulse Output
Manufacturer:
Microchip Technology
Datasheet:
Part Number:
Description:
Power Meter with SPI and Active Power Pulse Output & Internal Oscillator., -40C to +85C, 28-SPDIP, TUBE
Manufacturer:
Microchip Technology
Datasheet:
Part Number:
Description:
Analog to Digital Converters - ADC Energy Meter IC Gain Dynamic Range
Manufacturer:
Microchip Technology

Part Number:
Description:
Manufacturer:
Microchip Technology Inc.
Datasheet:
Part Number:
Description:
Manufacturer:
Microchip Technology Inc.
Datasheet:
Part Number:
Description:
Manufacturer:
Microchip Technology Inc.
Datasheet:
Part Number:
Description:
Manufacturer:
Microchip Technology Inc.
Datasheet:
Part Number:
Description:
Manufacturer:
Microchip Technology Inc.
Datasheet:
Part Number:
Description:
Manufacturer:
Microchip Technology Inc.
Datasheet:
Part Number:
Description:
Manufacturer:
Microchip Technology Inc.
Datasheet: