XE8000EV104 Semtech, XE8000EV104 Datasheet - Page 118
XE8000EV104
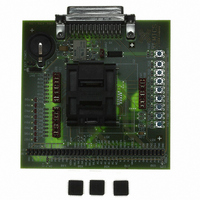
Manufacturer Part Number
XE8000EV104
Description
EVAL BOARD FOR XE8805AMI028LF
Manufacturer
Semtech
Type
MCUr
Specifications of XE8000EV104
Contents
Fully Assembled Evaluation Board
For Use With/related Products
XE88LC05AMI028
Lead Free Status / RoHS Status
Contains lead / RoHS non-compliant


16.9.4
The incremental ADC is an over-sampled converter with two main blocks: an analog modulator and a low-pass
digital filter. The main function of the digital filter is to remove the quantization noise introduced by the modulator.
As shown in Figure 16-26, this filter determines the frequency response of the transfer function between the output
of the ADC and the analog input V
period OSR/f
elementary conversions N
and are repeated every f
Information on the location of these notches is particularly useful when specific frequencies must be filtered out by
the acquisition system. For example, consider a 5Hz-bandwidth, 16-bit sensing system where 50Hz line rejection is
needed. Using the above equation and the plots below, we set the 4th notch for N
1.25⋅f
choice yields also good attenuation of 50Hz harmonics.
© Semtech 2006
1.2
0.8
0.6
0.4
0.2
1.2
0.8
0.6
0.4
0.2
4)
5)
6)
1
0
S
1
0
/OSR = 50Hz. The sampling frequency is then calculated as f
0
0
f
For highest linearity and lowest noise performance, bypass all PGAs and use the ADC alone (applications
where no "zooming" is needed); i.e. set ENABLE[3:0] = '0001'.
For low-noise applications where power consumption is not a primary concern, maintain the largest bias
currents in the PGAs and in the ADC; i.e. set IB_AMP_PGA[1:0] = IB_AMP_ADC[1:0] = '11'.
For lowest output offset error at the output of the ADC, bypass PGA2 and PGA3. Indeed, PGA2 and
PGA3 typically introduce an offset of about 5 to 10 LSB (16 bit) at their output. Note, however, that the
ADC output offset is easily calibrated out by software.
NOTCH
Frequency Response
Figure 16-26. Frequency response: normalized magnitude vs. frequency for different N
S
. The plots of Figure 16-26 also show that the frequency response changes with the number of
Normalized Frequency - f *(OSR/f
) (
Normalized Frequency - f *(OSR/f
i
1
1
=
OSR
i
⋅
S
⋅
N
/OSR.
ELCONV
f
ELCONV
2
S
2
performed. In particular, notches appear for N
IN
N
N
ELCONV
. Notice that the frequency axes are normalized to one elementary conversion
ELCONV
3
S
3
S
) [-]
) [-]
(Hz)
= 1
= 4
4
4
for
i
=
1
16-32
2 ,
1.2
0.8
0.6
0.4
0.2
1.2
0.8
0.6
0.4
0.2
,...,
1
0
1
0
0
0
(
N
ELCONV
Normalized Frequency - f *(OSR/f
Normalized Frequency - f *(OSR/f
1
−
1
S
) 1
= 20.48kHz for OSR = 512. Notice that this
ELCONV
2
2
(Eq. 23)
≥ 2. These notches occur at:
N
N
ELCONV
ELCONV
3
3
S
S
) [-]
ELCONV
) [-]
= 2
= 8
XE8805/05A
= 4 to 50Hz, i.e.
4
4
www.semtech.com
ELCONV
Related parts for XE8000EV104
Image
Part Number
Description
Manufacturer
Datasheet
Request
R

Part Number:
Description:
EVALUATION BOARD
Manufacturer:
Semtech
Datasheet:
Part Number:
Description:
EVALUATION BOARD
Manufacturer:
Semtech
Datasheet:
Part Number:
Description:
VOLTAGE SUPPRESSOR, TRANSIENT SEMTECH
Manufacturer:
Semtech
Datasheet:

Part Number:
Description:
HIGH VOLTAGE CAPACITORS MONOLITHIC CERAMIC TYPE
Manufacturer:
Semtech Corporation
Datasheet:
Part Number:
Description:
EZ1084CM5.0 AMP POSITIVE VOLTAGE REGULATOR
Manufacturer:
Semtech Corporation
Datasheet:
Part Number:
Description:
3.0 AMP LOW DROPOUT POSITIVE VOLTAGE REGULATORS
Manufacturer:
Semtech Corporation
Datasheet:
Part Number:
Description:
Manufacturer:
Semtech Corporation
Datasheet:
Part Number:
Description:
RailClamp Low Capacitance TVS Diode Array
Manufacturer:
Semtech Corporation
Datasheet:
Part Number:
Description:
Manufacturer:
Semtech Corporation
Datasheet:
Part Number:
Description:
Manufacturer:
Semtech Corporation
Datasheet:
Part Number:
Description:
Manufacturer:
Semtech Corporation
Datasheet:
Part Number:
Description:
Manufacturer:
Semtech Corporation
Datasheet: