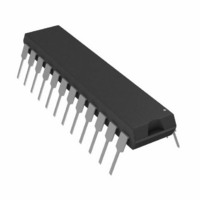
AD7870JNZ Analog Devices Inc, AD7870JNZ Datasheet - Page 17

AD7870JNZ
Manufacturer Part Number
AD7870JNZ
Description
IC ADC 12BIT LC2MOS 100KHZ 24DIP
Manufacturer
Analog Devices Inc
Datasheet
1.AD7870JNZ.pdf
(28 pages)
Specifications of AD7870JNZ
Data Interface
Serial, Parallel
Number Of Bits
12
Sampling Rate (per Second)
100k
Number Of Converters
1
Power Dissipation (max)
95mW
Voltage Supply Source
Dual ±
Operating Temperature
0°C ~ 70°C
Mounting Type
Through Hole
Package / Case
24-DIP (0.300", 7.62mm)
Resolution (bits)
12bit
Sampling Rate
100kSPS
Input Channel Type
Single Ended
Supply Voltage Range - Analog
± 4.75V To ± 5.25V
Supply Current
8mA
Number Of Elements
1
Resolution
12Bit
Architecture
SAR
Sample Rate
100KSPS
Input Polarity
Bipolar
Input Type
Voltage
Rated Input Volt
±3V
Differential Input
No
Power Supply Requirement
Dual
Single Supply Voltage (typ)
Not RequiredV
Single Supply Voltage (min)
Not RequiredV
Single Supply Voltage (max)
Not RequiredV
Dual Supply Voltage (typ)
±5V
Dual Supply Voltage (min)
±4.75V
Dual Supply Voltage (max)
±5.25V
Power Dissipation
95mW
Integral Nonlinearity Error
±0.5LSB(Typ)
Operating Temp Range
0C to 70C
Operating Temperature Classification
Commercial
Mounting
Through Hole
Pin Count
24
Package Type
PDIP
Input Signal Type
Single-Ended
Lead Free Status / RoHS Status
Lead free / RoHS Compliant
Lead Free Status / RoHS Status
Lead free / RoHS Compliant, Lead free / RoHS Compliant
Fourier transform (FFT) plot is generated from which the SNR
data can be obtained. Figure 18 shows a typical 2048 point FFT
plot of the AD7870KN/AD7875KN with an input signal of 25 kHz
and a sampling frequency of 100 kHz. The SNR obtained from
this graph is 72.6 dB. It should be noted that the harmonics are
taken into account when calculating the SNR.
Effective Number of Bits
The formula given in Equation 1 relates SNR to the number of
bits. Rewriting the formula, as in Equation 2, it is possible to get
a measure of performance expressed in effective number of
bits (N).
The effective number of bits for a device can be calculated
directly from its measured SNR.
Figure 19 shows a typical plot of effective number of bits vs.
frequency for an AD7870KN/AD7875KN with a sampling
frequency of 100 kHz. The effective number of bits typically
falls between 11.7 and 11.85 corresponding to SNR figures of
72.2 and 73.1 dB.
N
–120
–140
12.0
11.5
11.0
10.5
10.0
–30
–60
–90
=
0
SNR
0
0
INPUT FREQUENCY = 25kHz
SAMPLE FREQUENCY = 100kHz
SNR = 72.6dB
T
Figure 19. Effective Number of Bits vs. Frequency
SAMPLE FREQUENCY = 100kHz
T
A
. 6
A
= 25°C
= 25°C
−
02
6.25
. 1
76
12.5
Figure 18. FFT Plot
INPUT FREQUENCY (kHz)
18.75
FREQUENCY (kHz)
25.0
25
31.25
37.5
43.75
50.0
50
Rev. C | Page 17 of 28
(2)
Total Harmonic Distortion (THD)
THD is the ratio of the rms sum of harmonics to the rms
value of the fundamental. For the AD7870/AD7875, THD is
defined as
where V
V
sixth harmonic. The THD is also derived from the FFT plot of
the ADC output spectrum.
Intermodulation Distortion
With inputs consisting of sine waves at two frequencies, fa and
fb, any active device with nonlinearities creates distortion
products at sum and difference frequencies of mfa ± nfb where
m, n = 0, 1, 2, 3, and so on. Intermodulation terms are those
for which neither m nor n are equal to zero. For example, the
second order terms include (fa + fb) and (fa − fb), while the
third order terms include (2fa + fb), (2fa − fb), (fa + 2fb) and
(fa − 2fb).
Using the CCIF standard, where two input frequencies near the
top end of the input bandwidth are used, the second and third
order terms are of different significance. The second order
terms are usually distanced in frequency from the original sine
waves while the third order terms are usually at a frequency
close to the input frequencies. As a result, the second and third
order terms are specified separately. The calculation of the
intermodulation distortion is as per the THD specification
where it is the ratio of the rms sum of the individual distortion
products to the rms amplitude of the fundamental expressed in
dBs. In this case, the input consists of two, equal amplitude, low
distortion sine waves. Figure 20 shows a typical IMD plot for
the AD7870/AD7875.
Peak Harmonic or Spurious Noise
Peak harmonic or spurious noise is defined as the ratio of the
rms value of the next largest component in the ADC output
spectrum (up to FS/2 and excluding dc) to the rms value of the
fundamental. Normally, the value of this specification is deter-
mined by the largest harmonic in the spectrum, but for parts
where the harmonics are buried in the noise floor the peak is a
noise peak.
4
, V
THD
5
and V
1
is the rms amplitude of the fundamental and V
=
20
6
are the rms amplitudes of the second through the
log
V
2
2
AD7870/AD7875/AD7876
+
V
3
2
+
V
V
4
1
2
+
V
5
2
+
V
6
2
2
, V
3
,


