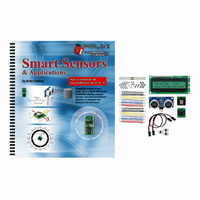
28029 Parallax Inc, 28029 Datasheet - Page 254

28029
Manufacturer Part Number
28029
Description
KIT PARTS SMART SENSORS W/TEXT
Manufacturer
Parallax Inc
Datasheet
1.122-28029.pdf
(340 pages)
Specifications of 28029
Accessory Type
Parts Kit
Product
Microcontroller Accessories
Lead Free Status / RoHS Status
Contains lead / RoHS non-compliant
For Use With/related Products
BASIC Stamp® or Javelin Modules
Lead Free Status / RoHS Status
Lead free / RoHS Compliant, Contains lead / RoHS non-compliant
Other names
28029PAR
- Current page: 254 of 340
- Download datasheet (5Mb)
Page 242 · Smart Sensors and Applications
Graphing Ollie Acceleration
Figure 6-15 shows a graph of the accelerometer's y-axis for the first of two ollies that
were datalogged with the next example program. Each step from Figure 6-14 is marked
on the graph.
This first ollie was a little deficient in Figure 6-14 steps b and c, so the back of the board
didn't quite meet the back foot in step e. Note that the impact of the board during step f
was 3.5 g. The highs and lows that follow step f resemble the oscillations when a bell is
struck. This is partially due to the board's vibration and partially due the turbulence of
the gas inside the accelerometer caused by the impact.
Figure 6-16 shows the data for a slightly better ollie. It was a little higher, and it made it
to step e gracefully. Notice that step a to b is steeper, and gets to -1.25 g before rising to
over 1 g for steps c and d. These values, which are larger than the ones from the previous
graph, indicate a higher ollie. Notice also that the impact was below 3 g, because the
skater was not trying to catch up with the board on the way down.
-0.5
-1.5
3.5
2.5
1.5
0.5
-1
a, b
3
2
1
0
170
190
Acceleration vs Tim e for First Ollie
c, d e
210
tim e (m s)
230
250
270
f
Figure 6-15
Acceleration during an
Ollie
Related parts for 28029
Image
Part Number
Description
Manufacturer
Datasheet
Request
R

Part Number:
Description:
Microcontroller Modules & Accessories DISCONTINUED BY PARALLAX
Manufacturer:
Parallax Inc

Part Number:
Description:
BOOK UNDERSTANDING SIGNALS
Manufacturer:
Parallax Inc
Datasheet:

Part Number:
Description:
COMPETITION RING FOR SUMOBOT
Manufacturer:
Parallax Inc
Datasheet:

Part Number:
Description:
TEXT INFRARED REMOTE FOR BOE-BOT
Manufacturer:
Parallax Inc
Datasheet:

Part Number:
Description:
BOARD EXPERIMENT+LCD NX-1000
Manufacturer:
Parallax Inc
Datasheet:

Part Number:
Description:
CONTROLLER 16SERVO MOTOR CONTROL
Manufacturer:
Parallax Inc
Datasheet:

Part Number:
Description:
BASIC STAMP LOGIC ANALYZER
Manufacturer:
Parallax Inc
Datasheet:

Part Number:
Description:
IC MCU 2K FLASH 50MHZ SO-18
Manufacturer:
Parallax Inc
Datasheet:


