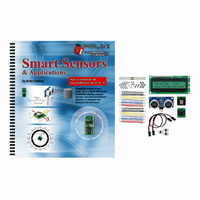
28029 Parallax Inc, 28029 Datasheet - Page 309

28029
Manufacturer Part Number
28029
Description
KIT PARTS SMART SENSORS W/TEXT
Manufacturer
Parallax Inc
Datasheet
1.122-28029.pdf
(340 pages)
Specifications of 28029
Accessory Type
Parts Kit
Product
Microcontroller Accessories
Lead Free Status / RoHS Status
Contains lead / RoHS non-compliant
For Use With/related Products
BASIC Stamp® or Javelin Modules
Lead Free Status / RoHS Status
Lead free / RoHS Compliant, Contains lead / RoHS non-compliant
Other names
28029PAR
- Current page: 309 of 340
- Download datasheet (5Mb)
E2. The goal of the expression
P1. Example solution – modified main routine from PingBarGraph.bs2.
Stripes
1625 + 1
be anywhere from 1875 to 3125, to a value from 1 to 31. This will pick one of
31 possible vertical bar graph possibilities for the
By the time the
range is 0 to 1250 (1251 input scale elements), and we want to scale that to a
range of 1 to 31 (31 output scale elements). From Chapter 3, Activity #3, we
know that ** ScaleConstant = Int[65536 × (output scale elements ÷ (input scale
elements – 1))]. So, it’s Int[65536 × (31 ÷ (1251 – 1))] = Int[65536 × (31 ÷
1250)] = Int[65536 × 0.0248] = Int[1625.2928] = 1625.
' -----[ Main Routine ]------------------------------------------------
DO
LOOP
PULSOUT 15, 5
PULSIN 15, 1, time
cmDistance = CmConstant ** time
DEBUG HOME, DEC3 cmDistance, " cm"
value = cmDistance
GOSUB Bar_Graph
SEROUT 14, 84, [Line1, DEC4 value,
PAUSE 100
in Activity #3 is to scale the x-axis accelerometer value, which could
**
DATA
operator is reached, 1875 has already been subtracted, so the
" cm"]
value = (x MIN 1875 MAX 3125) - 1875 **
Chapter 7: LCD Bar Graphs for Distance and Tilt · Page 297
%11111,
%00000,
%11111,
%00000,
%11111,
%00000,
%11111,
%00000
' Main loop
' Display as bar graph
' Display cm measurement
' Repeat main loop
' on Line 1
' * * * * *
'
' * * * * *
'
' * * * * *
'
' * * * * *
'
Bar_Graph_H_V
subroutine.
Related parts for 28029
Image
Part Number
Description
Manufacturer
Datasheet
Request
R

Part Number:
Description:
Microcontroller Modules & Accessories DISCONTINUED BY PARALLAX
Manufacturer:
Parallax Inc

Part Number:
Description:
BOOK UNDERSTANDING SIGNALS
Manufacturer:
Parallax Inc
Datasheet:

Part Number:
Description:
COMPETITION RING FOR SUMOBOT
Manufacturer:
Parallax Inc
Datasheet:

Part Number:
Description:
TEXT INFRARED REMOTE FOR BOE-BOT
Manufacturer:
Parallax Inc
Datasheet:

Part Number:
Description:
BOARD EXPERIMENT+LCD NX-1000
Manufacturer:
Parallax Inc
Datasheet:

Part Number:
Description:
CONTROLLER 16SERVO MOTOR CONTROL
Manufacturer:
Parallax Inc
Datasheet:

Part Number:
Description:
BASIC STAMP LOGIC ANALYZER
Manufacturer:
Parallax Inc
Datasheet:

Part Number:
Description:
IC MCU 2K FLASH 50MHZ SO-18
Manufacturer:
Parallax Inc
Datasheet:


