CDB5534U Cirrus Logic Inc, CDB5534U Datasheet - Page 17
CDB5534U
Manufacturer Part Number
CDB5534U
Description
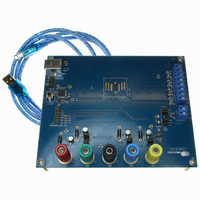
EVAL BOARD FOR CS5534
Manufacturer
Cirrus Logic Inc
Specifications of CDB5534U
Number Of Adc's
1
Number Of Bits
24
Sampling Rate (per Second)
3.84k
Data Interface
Serial
Inputs Per Adc
2 Single
Input Range
0 ~ 2.5 V
Power (typ) @ Conditions
35mW @ 5 V
Voltage Supply Source
Analog and Digital, Dual ±
Operating Temperature
-40°C ~ 85°C
Utilized Ic / Part
CS5534
Description/function
Audio DSPs
Operating Supply Voltage
5 V
Product
Audio Modules
For Use With/related Products
C8051F320
Lead Free Status / RoHS Status
Contains lead / RoHS non-compliant
Lead Free Status / RoHS Status
Lead free / RoHS Compliant, Contains lead / RoHS non-compliant
Other names
598-1016


2.7
The following is a description of the indicators associated with Histogram Analysis. Histograms can be plot-
ted in the Data Collection Window by setting the Time Domain / FFT / Histogram selector to Histogram.
BIN: Displays the x-axis value of the cursor on the Histogram.
MAGNITUDE: Displays the y-axis value of the cursor on the Histogram.
MAXIMUM: Indicator for the maximum value of the collected data set.
MEAN: Indicator for the average of the data sample set.
MINIMUM: Indicator for the minimum value of the collected data set.
STD. DEV.: Indicator for the Standard Deviation of the collected data set.
VARIANCE: Indicates the Variance for the current data set.
2.8
The following describe the indicators associated with FFT (Fast Fourier Transform) Analysis. FFT data
can be plotted in the Data Collection Window by setting the Time Domain / FFT / Histogram selector to FFT.
FREQUENCY: Displays the x-axis value of the cursor on the FFT display.
MAGNITUDE: Displays the y-axis value of the cursor on the FFT display.
S/D: Indicator for the Signal-to-Distortion Ratio, 4 harmonics are used in the calculations (decibels).
S/N+D: Indicator for the Signal-to-Noise + Distortion Ratio (decibels).
SNR: Indicator for the Signal-to-Noise Ratio, first 4 harmonics are not included (decibels).
S/PN: Indicator for the Signal-to-Peak Noise Ratio (decibels).
# of AVG: Displays the number of FFT’s averaged in the current display.
2.9
The following controls and indicators are associated with Time Domain Analysis. Time domain data can
be plotted in the Data Collection Window by setting the Time Domain / FFT / Histogram selector to Time
Domain.
COUNT: Displays current x-position of the cursor on the time domain display.
MAGNITUDE: Displays current y-position of the cursor on the time domain display.
MAXIMUM: Indicator for the maximum value of the collected data set.
MINIMUM: Indicator for the minimum value of the collected data set.
DS289DB6
Histogram Information
Frequency Domain Information
Time Domain Information
CDB5534U
17
Related parts for CDB5534U
Image
Part Number
Description
Manufacturer
Datasheet
Request
R

Part Number:
Description:
Development Kit
Manufacturer:
Cirrus Logic Inc
Datasheet:
Part Number:
Description:
Development Kit
Manufacturer:
Cirrus Logic Inc
Datasheet:


Part Number:
Description:
High-efficiency PFC + Fluorescent Lamp Driver Reference Design
Manufacturer:
Cirrus Logic Inc
Datasheet:
Part Number:
Description:
Development Kit
Manufacturer:
Cirrus Logic Inc
Datasheet:
Part Number:
Description:
Development Kit
Manufacturer:
Cirrus Logic Inc
Datasheet:

Part Number:
Description:
Development Kit
Manufacturer:
Cirrus Logic Inc
Datasheet:
Part Number:
Description:
Development Kit
Manufacturer:
Cirrus Logic Inc
Datasheet:
Part Number:
Description:
Development Kit
Manufacturer:
Cirrus Logic Inc
Datasheet:
Part Number:
Description:
Development Kit
Manufacturer:
Cirrus Logic Inc
Datasheet:

Part Number:
Description:
EVALUATION BOARD FOR CS8427
Manufacturer:
Cirrus Logic Inc
Datasheet:

Part Number:
Description:
BOARD EVAL FOR CS8416 RCVR
Manufacturer:
Cirrus Logic Inc
Datasheet:

Part Number:
Description:
EVALUATION BOARD FOR CS8420
Manufacturer:
Cirrus Logic Inc
Datasheet:

Part Number:
Description:
KIT DEVELOPMENT EP9315 ARM9
Manufacturer:
Cirrus Logic Inc
Datasheet:

Part Number:
Description:
KIT DEVELOPMENT EP9302 ARM9
Manufacturer:
Cirrus Logic Inc
Datasheet: