CDB5376 Cirrus Logic Inc, CDB5376 Datasheet - Page 50
CDB5376
Manufacturer Part Number
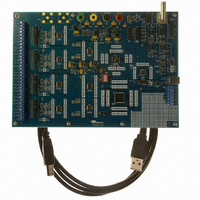
CDB5376
Description
EVALUATION BOARD FOR CS5376
Manufacturer
Cirrus Logic Inc
Datasheets
1.CS5371A-ISZR.pdf
(32 pages)
2.CS4373A-ISZ.pdf
(34 pages)
3.CS5376A-IQZR.pdf
(106 pages)
4.CDB5378.pdf
(16 pages)
5.CDB5376.pdf
(80 pages)
6.CDB5376.pdf
(16 pages)
Specifications of CDB5376
Main Purpose
Seismic Evaluation System
Embedded
Yes, MCU, 8-Bit
Utilized Ic / Part
CS3301A, CS3302A, CS4373A, CS5372A, CS5376A
Primary Attributes
Quad Digital Filter
Secondary Attributes
Graphical User Interface, SPI™ & USB Interfaces
Processor To Be Evaluated
CS330x, CS4373A, CS537x
Interface Type
USB
Lead Free Status / RoHS Status
Contains lead / RoHS non-compliant
Lead Free Status / RoHS Status
Lead free / RoHS Compliant, Contains lead / RoHS non-compliant
Other names
598-1778


3.4.4
The Cursor control is used to identify a point on the graph using the mouse and then display its plot values.
When any point within the plot area of the graph is clicked, the Cursor will snap to the closest plotted point
and the plot values for that point display below the graph.
When using the Zoom function, the Cursor is used to select the corners of the area to zoom.
3.4.5
The ZOOM function allows an area on the graph to be expanded. To use the zoom function, click the
ZOOM button and select the box corners of the area on the graph to expand. The graph will then expand
to show the details of this area, and the plot axes will be re-scaled. While zoomed, you can zoom in farther
by repeating the process.
To restore the graph to its original scale, click the RESTORE button that appears while zoomed. If mul-
tiple zooms have been initiated, the RESTORE button will return to the previously viewed plot scale. Re-
peated RESTORE will eventually return to the original plot scale. From within multiple zooms the original
scale can be directly restored by clicking the REFRESH button.
3.4.6
The REFRESH button will clear and re-plot the current data set. Refresh can be used to apply new anal-
ysis parameters from the Data Capture sub-panel, or to restore a ZOOM graph to its default plot scale.
3.4.7
The HARMONICS control is only visible during a Signal FFT analysis and highlights the fundamental and
harmonic bins used to calculate the Signal FFT statistics. HARMONICS highlighting helps to understand
the source of any Signal FFT plot errors.
3.4.8
The Spot Noise control (labeled dB or nV) is only visible during a Noise FFT analysis and selects the units
used for plotting the graph, either dB/Hz or nV/rtHz. The dB/Hz plot applies the Full Scale Code value from
the Data Capture sub-panel on the Setup panel to determine the 0 dB point of the dB axis. The nV/rtHz
plot applies the Full Scale Voltage value from the Data Capture sub-panel on the Setup panel to deter-
mine the absolute scaling of the nV axis.
3.4.9
The PLOT ERROR control provides information about errors that occured during an analysis. Analysis
errors are only reported if the channel that has the error is currently plotted.
An analysis error stores an error code in the numerical display box of the PLOT ERROR control. If more
than one error occurs, all error codes are stored and the last error code is displayed. Any of the accumu-
lated error codes can be displayed by clicking on the numerical box and selecting it.
Once an error code is displayed in the numerical box, a description can be displayed by clicking the PLOT
ERROR button. This causes a dialog box to display showing the error number, the error channel, and a
text error message.
50
Cursor
Zoom
Refresh
Harmonics
Spot Noise
Plot Error
CDB5376
DS612DB3
Related parts for CDB5376
Image
Part Number
Description
Manufacturer
Datasheet
Request
R

Part Number:
Description:
Development Kit
Manufacturer:
Cirrus Logic Inc
Datasheet:
Part Number:
Description:
Development Kit
Manufacturer:
Cirrus Logic Inc
Datasheet:


Part Number:
Description:
High-efficiency PFC + Fluorescent Lamp Driver Reference Design
Manufacturer:
Cirrus Logic Inc
Datasheet:
Part Number:
Description:
Development Kit
Manufacturer:
Cirrus Logic Inc
Datasheet:
Part Number:
Description:
Development Kit
Manufacturer:
Cirrus Logic Inc
Datasheet:

Part Number:
Description:
Development Kit
Manufacturer:
Cirrus Logic Inc
Datasheet:
Part Number:
Description:
Development Kit
Manufacturer:
Cirrus Logic Inc
Datasheet:
Part Number:
Description:
Development Kit
Manufacturer:
Cirrus Logic Inc
Datasheet:
Part Number:
Description:
Development Kit
Manufacturer:
Cirrus Logic Inc
Datasheet:

Part Number:
Description:
EVALUATION BOARD FOR CS8427
Manufacturer:
Cirrus Logic Inc
Datasheet:

Part Number:
Description:
BOARD EVAL FOR CS8416 RCVR
Manufacturer:
Cirrus Logic Inc
Datasheet:

Part Number:
Description:
EVALUATION BOARD FOR CS8420
Manufacturer:
Cirrus Logic Inc
Datasheet:

Part Number:
Description:
KIT DEVELOPMENT EP9315 ARM9
Manufacturer:
Cirrus Logic Inc
Datasheet:

Part Number:
Description:
KIT DEVELOPMENT EP9302 ARM9
Manufacturer:
Cirrus Logic Inc
Datasheet: