PMF18WE1 Microchip Technology, PMF18WE1 Datasheet - Page 65
PMF18WE1
Manufacturer Part Number
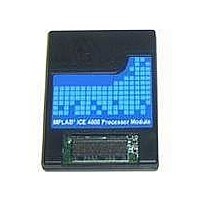
PMF18WE1
Description
PROCESSOR MODULE FOR ICE4000
Manufacturer
Microchip Technology
Datasheet
1.ICE4000.pdf
(98 pages)
Specifications of PMF18WE1
Module/board Type
Processor Module
Product
Microcontroller Modules
Core Processor
PIC18F6585/6680/8585/8680
Lead Free Status / RoHS Status
Contains lead / RoHS non-compliant
For Use With/related Products
ICE4000
Lead Free Status / RoHS Status
Lead free / RoHS Compliant, Contains lead / RoHS non-compliant


8.4
8.5
2004 Microchip Technology Inc.
VIEW MENU
RIGHT MOUSE BUTTON MENU
• Complex Triggers and Code Coverage
• Stopwatch
• Additional Commands
• Upload Program Memory from ICE
• Reinitialize ICE Hardware
• Settings
The following items are added to the View menu.
• ICE Trace
Some or all of following will appear on the right mouse menus in code displays, such
as program memory and source code files.
• Set/Remove Breakpoint
• Enable/Disable Breakpoint
• Breakpoints
For more on breakpoints, see Section 4.5 “Using Software Breakpoints”.
• Run To Cursor
• Set PC at Cursor
• Center Debug Location
• Cursor Tracks Debug Location
Opens the MPLAB ICE 4000 Analyzer Properties dialog. Here you may set up
Complex Trigger Settings (Chapter 6. “Complex and Internal Triggers”),
Trigger In/Out Settings (Section 4.7 “Using Trigger In/Out Settings”) and Code
Coverage (Section 7.3 “Code Coverage”).
Opens the complex stopwatch dialog (Section 4.9 “Using the Stopwatch”).
Fill data memory as specified or force the execution of an opcode
(Section 8.8 “Additional Commands Dialog, Data Fill Tab”).
Used for monitoring the effects of self-modifying code. Transfer program memory
in the MPLAB ICE 4000 to the MPLAB IDE Program Memory window.
Performs a system reset of the MPLAB ICE 4000.
Opens the MPLAB ICE 4000 Settings dialog (Section 8.10 “Settings Dialog,
Port Tab”). Set up the port, clock, power, break options and pins. Also, find out
information about the current system configuration and device limitations.
Display the window containing the current trace of your program’s execution
(Chapter 7. “Code Coverage, Trace Memory, Real-Time Reads”).
Set or remove a breakpoint at the currently selected line.
Enable or disable a breakpoint at the currently selected line.
Remove, enable or disable all breakpoints.
Run the program to the current cursor location. Formerly Run to Here.
Set the program counter (PC) to the cursor location.
Center the current PC line in the window.
Cursor (arrow) will track the current debug location.
Emulator Function Summary
DS51490A-page 59
Related parts for PMF18WE1
Image
Part Number
Description
Manufacturer
Datasheet
Request
R

Part Number:
Description:
Manufacturer:
Microchip Technology Inc.
Datasheet:
Part Number:
Description:
Manufacturer:
Microchip Technology Inc.
Datasheet:
Part Number:
Description:
Manufacturer:
Microchip Technology Inc.
Datasheet:
Part Number:
Description:
Manufacturer:
Microchip Technology Inc.
Datasheet:
Part Number:
Description:
Manufacturer:
Microchip Technology Inc.
Datasheet:
Part Number:
Description:
Manufacturer:
Microchip Technology Inc.
Datasheet:
Part Number:
Description:
Manufacturer:
Microchip Technology Inc.
Datasheet:
Part Number:
Description:
Manufacturer:
Microchip Technology Inc.
Datasheet: