EA-QSB-102 Embedded Artists, EA-QSB-102 Datasheet - Page 24
EA-QSB-102
Manufacturer Part Number
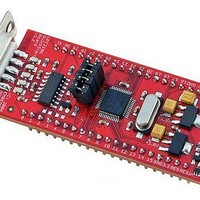
EA-QSB-102
Description
MCU, MPU & DSP Development Tools QUICKSTART PROTOTYPE BRD W/ LPC2106 RS232
Manufacturer
Embedded Artists
Specifications of EA-QSB-102
Processor To Be Evaluated
LPC2106
Data Bus Width
16 bit, 32 bit
Interface Type
RS-232, I2C, SPI, UART
Core
ARM7TDMI-S
Dimensions
27.9 mm x 65.3 mm
Maximum Operating Temperature
+ 85 C
Operating Supply Voltage
5 V
Lead Free Status / RoHS Status
Lead free / RoHS Compliant


NXP Semiconductors
LPC2104_2105_2106_7
Product data sheet
6.19.1 EmbeddedICE
6.19.2 Embedded trace
6.19 Emulation and debugging
processor clock rate. The second purpose of the APB divider is to allow power savings
when an application does not require any peripherals to run at the full processor rate.
Because the APB divider is connected to the PLL output, the PLL remains active (if it was
running) during Idle mode.
The LPC2104/2105/2106 support emulation and debugging via a JTAG serial port. A trace
port allows tracing program execution. Each of these functions requires a trade-off of
debugging features versus device pins. Because the LPC2104/2105/2106 are provided in
a small package, there is no room for permanently assigned JTAG or Trace pins. An
alternate JTAG port allows an option to debug functions assigned to the pins used by the
primary JTAG port (see
Standard ARM EmbeddedICE logic provides on-chip debug support. The debugging of
the target system requires a host computer running the debugger software and an
EmbeddedICE protocol convertor. EmbeddedICE protocol convertor converts the Remote
Debug Protocol commands to the JTAG data needed to access the ARM core.
The ARM core has a Debug Communication Channel function built-in. The debug
communication channel allows a program running on the target to communicate with the
host debugger or another separate host without stopping the program flow or even
entering the debug state. The debug communication channel is accessed as a
co-processor 14 by the program running on the ARM7TDMI-S core. The debug
communication channel allows the JTAG port to be used for sending and receiving data
without affecting the normal program flow. The debug communication channel data and
control registers are mapped in to addresses in the EmbeddedICE logic.
The JTAG clock (TCK) must be slower than
interface to operate.
Since the LPC2104/2105/2106 have significant amounts of on-chip memory, it is not
possible to determine how the processor core is operating simply by observing the
external pins. The Embedded Trace Macrocell (ETM) provides real-time trace capability
for deeply embedded processor cores. It outputs information about processor execution to
the trace port.
The ETM is connected directly to the ARM core and not to the main AMBA system bus. It
compresses the trace information and exports it through a narrow trace port. An external
trace port analyzer must capture the trace information under software debugger control.
Instruction trace (or PC trace) shows the flow of execution of the processor and provides a
list of all the instructions that were executed. Instruction trace is significantly compressed
by only broadcasting branch addresses as well as a set of status signals that indicate the
pipeline status on a cycle by cycle basis. Trace information generation can be controlled
by selecting the trigger resource. Trigger resources include address comparators,
counters and sequencers. Since trace information is compressed the software debugger
requires a static image of the code being executed. Self-modifying code cannot be traced
because of this restriction.
Rev. 07 — 20 June 2008
Section
6.8).
1
6
of the CPU clock (CCLK) for the JTAG
LPC2104/2105/2106
Single-chip 32-bit microcontrollers
© NXP B.V. 2008. All rights reserved.
24 of 41
Related parts for EA-QSB-102
Image
Part Number
Description
Manufacturer
Datasheet
Request
R

Part Number:
Description:
MCU, MPU & DSP Development Tools QUICKSTART PROTOTYPE BRD W/ LPC2129 CAN
Manufacturer:
Embedded Artists
Datasheet:

Part Number:
Description:
MCU, MPU & DSP Development Tools QUICKSTART PROTOTYPE BRD
Manufacturer:
Embedded Artists
Datasheet:

Part Number:
Description:
MCU, MPU & DSP Development Tools LPC2148 USB QUICKSTART BRD
Manufacturer:
Embedded Artists
Datasheet:
Part Number:
Description:
MCU, MPU & DSP Development Tools LPC2129 CAN QUICKSTART BRD
Manufacturer:
Embedded Artists
Datasheet:
Part Number:
Description:
MCU, MPU & DSP Development Tools QUICKSTART PROTOTYPE BRD W/ LPC2148
Manufacturer:
Embedded Artists
Datasheet:

Part Number:
Description:
MCU, MPU & DSP Development Tools LPC2106 RS232 QUICKSTART BRD
Manufacturer:
Embedded Artists
Datasheet:

Part Number:
Description:
BOARD QUICK START LPC1343
Manufacturer:
Embedded Artists
Datasheet:

Part Number:
Description:
Development Boards & Kits - ARM QUICK START BOARD LPC11U35
Manufacturer:
Embedded Artists
Datasheet:
Part Number:
Description:
KIT LPC3141 SODIMM 66X48 200POS
Manufacturer:
Embedded Artists
Datasheet:
Part Number:
Description:
KIT LPC3152 SODIMM 66X48 200POS
Manufacturer:
Embedded Artists
Datasheet:
Part Number:
Description:
BOARD OEM W/LPC2478 MCU
Manufacturer:
Embedded Artists
Datasheet:
Part Number:
Description:
KIT LPC3250 259 WITH QVGA
Manufacturer:
Embedded Artists
Datasheet: