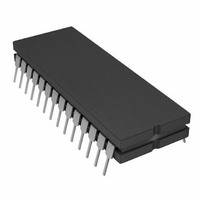
AD7878SQ Analog Devices Inc, AD7878SQ Datasheet - Page 9

AD7878SQ
Manufacturer Part Number
AD7878SQ
Description
IC ADC 12BIT W/DSP INT 28-CDIP
Manufacturer
Analog Devices Inc
Datasheet
1.AD7878JPZ-REEL.pdf
(16 pages)
Specifications of AD7878SQ
Rohs Status
RoHS non-compliant
Number Of Bits
12
Sampling Rate (per Second)
100k
Data Interface
DSP
Number Of Converters
1
Power Dissipation (max)
95.5mW
Voltage Supply Source
Analog and Digital, Dual ±
Operating Temperature
-55°C ~ 125°C
Mounting Type
Through Hole
Package / Case
28-CDIP (0.600", 15.24mm)
Available stocks
Company
Part Number
Manufacturer
Quantity
Price
Part Number:
AD7878SQ
Manufacturer:
ADI/亚德诺
Quantity:
20 000
Figure 11 shows a typical plot of effective number of bits versus
frequency for an AD7878KN with a sampling frequency of
100 kHz. The effective number of bits typically falls between
11.7 and 11.85 corresponding to SNR figures of 72.2 and
73.1 dB.
Harmonic Distortion
Harmonic Distortion is the ratio of the rms sum of harmonics to
the fundamental. For the AD7878, Total Harmonic Distortion
(THD) is defined as:
where V
V
harmonic. The THD is also derived from the FFT plot of the
ADC output spectrum.
Intermodulation Distortion
With inputs consisting of sine waves at two frequencies, fa and
fb, any active device with nonlinearities will create distortion
products at sum and difference frequencies of mfa + nfb where
m, n = 0, 1, 2, 3 . . . . , etc. Intermodulation terms are those for
which neither m nor n is equal to zero. For example, the second
order terms include (fa + fb) and (fa – fb) while the third order
terms include (2fa + fb), (2fa – fb), (fa + 2fb) and (fa – 2fb).
Using the CCIF standard, where two input frequencies near the
top end of the input bandwidth are used, the second and third
order terms are of different significance. The second order terms
are usually distanced in frequency from the original sine waves,
while the third order terms are usually at a frequency close to the
input frequencies. As a result, the second and third order terms
are specified separately. The calculation of the intermodulation
distortion is as per the THD specification where it is the ratio of
the rms sum of the individual distortion products to the rms am-
plitude of the fundamental expressed in dBs.
Intermodulation distortion is calculated using an FFT algorithm
but, in this case, the input consists of two equal amplitude, low
distortion sine waves. Figure 12 shows a typical IMD plot for
the AD7878.
Peak Harmonic or Spurious Noise
Peak harmonic or spurious noise is defined as the ratio of the
rms value of the next largest component in the ADC output
spectrum (up to FS/2 and excluding dc) to the rms value of the
fundamental. Normally, the value of this specification will be
determined by the largest harmonic in the spectrum, but for
parts where the harmonics are buried in the noise floor the
largest peak will be a noise peak.
REV. A
4
, V
Figure 11. Effective Number of Bits vs. Frequency
5
and V
1
is the rms amplitude of the fundamental and V
THD
6
are the rms amplitudes of the second to the sixth
20 log
(
V
2
2
V
3
2
V
V
1
4
2
V
5
2
V
6
2
)
2
, V
3
,
–9–
Histogram Plot
When a sine wave of a specified frequency is applied to the V
input of the AD7878 and several million samples are taken, it is
possible to plot a histogram showing the frequency of occur-
rence of each of the 4096 ADC codes. If a particular step is
wider than the ideal 1 LSB width, then the code associated with
that step will accumulate more counts than for the code for an
ideal step. Likewise, a step narrower than ideal will have fewer
counts. Missing codes are easily seen in the histogram plot because
a missing code means zero counts for a particular code. Large
spikes in the plot indicate large differential nonlinearity.
Figure 13 shows a histogram plot for the AD7878KN with a
sampling frequency of 100 kHz and an input frequency of
25 kHz. For a sine-wave input, a perfect ADC would produce a
cusp probability density function described by the equation:
where A is the peak amplitude of the sine wave and p (V) is the
probability of occurrence at a voltage V. The histogram plot of
Figure 13 corresponds very well with this cusp shape. The ab-
sence of large spikes in this plot indicates small dynamic differ-
ential nonlinearity (the largest spike in the plot represents less
than 1/4 LSB of DNL error). The AD7878 has no missing
codes under these conditions since no code records zero counts.
Figure 13. AD7878 Histogram Plot
Figure 12. AD7878 IMD Plot
p (V )
( A
1
2
–V
2
)
AD7878
IN


