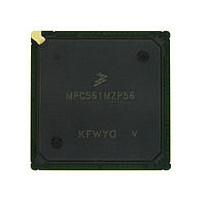
MPC561MZP56 Freescale, MPC561MZP56 Datasheet - Page 915

MPC561MZP56
Manufacturer Part Number
MPC561MZP56
Description
Manufacturer
Freescale
Datasheet
1.MPC561MZP56.pdf
(1420 pages)
Specifications of MPC561MZP56
Cpu Family
MPC56x
Device Core
PowerPC
Device Core Size
32b
Frequency (max)
56MHz
Interface Type
QSPI/SCI/SPI/UART
Total Internal Ram Size
32KB
# I/os (max)
56
Number Of Timers - General Purpose
22
Operating Supply Voltage (typ)
2.6/5V
Operating Supply Voltage (max)
2.7/5.25V
Operating Supply Voltage (min)
2.5/4.75V
On-chip Adc
2(32-chx10-bit)
Instruction Set Architecture
RISC
Operating Temp Range
-40C to 125C
Operating Temperature Classification
Automotive
Mounting
Surface Mount
Pin Count
388
Package Type
BGA
Program Memory Type
ROMLess
Program Memory Size
Not Required
Lead Free Status / RoHS Status
Not Compliant
Available stocks
Company
Part Number
Manufacturer
Quantity
Price
Company:
Part Number:
MPC561MZP56
Manufacturer:
Freescale Semiconductor
Quantity:
10 000
Company:
Part Number:
MPC561MZP56R2
Manufacturer:
Freescale Semiconductor
Quantity:
10 000
- Current page: 915 of 1420
- Download datasheet (11Mb)
Chapter 23
Development Support
The visibility and controllability requirements of emulators and bus analyzers are in opposition to the trend
of modern microcomputers and microprocessors where many bus cycles are directed to internal resources
and are not visible externally.
In order to enhance the development tool visibility and controllability, some of the development support
functions are implemented in silicon. These functions include program flow tracking, internal watchpoint,
breakpoint generation, and emulation while in debug mode.
This section covers program flow tracking support, breakpoint/watchpoint support, development system
interface support (debug mode) and software monitor debugger support. These features allow efficiency
in debugging systems based on the MPC561/MPC563.
23.1
The mechanism described in this section allows tracking of program instruction flow with almost no
performance degradation. The information provided may be compressed and captured externally and then
parsed by a post-processing program using the microarchitecture defined below.
The program instructions flow is visible on the external bus when the MPC561/MPC563 is programmed
to operate in serial mode and show all fetch cycles on the external bus. This mode is selected by
programming the ISCT_SER (instruction fetch show cycle control) field in the I-bus support control
register (ICTRL), as shown in
fetch cycles appear on the external bus. Processor performance is, therefore, much lower than when
working in regular mode.
These features, together with the fact that most fetch cycles are performed internally (e.g., from the
I-cache), increase performance but make it very difficult to provide the real program trace.
In order to reconstruct a program trace, the program code and the following additional information from
the MCU are needed:
Instructions are fetched sequentially until branches (direct or indirect) or exceptions appear in the program
flow or some stall in execution causes the machine not to fetch the next address. Instructions may be
architecturally executed, or they may be canceled in some stage of the machine pipeline.
Freescale Semiconductor
•
•
•
A description of the last fetched instruction (stall, sequential, branch not taken, branch direct taken,
branch indirect taken, exception taken)
The addresses of the targets of all indirect flow change. Indirect flow changes include all branches
using the link and count registers as the target address, all exceptions, and rfi, mtmsr and mtspr (to
some registers) because they may cause a context switch.
The number of instructions canceled each clock
Program Flow Tracking
Table
MPC561/MPC563 Reference Manual, Rev. 1.2
23-26. In this mode, the processor is fetch serialized, and all internal
23-1
Related parts for MPC561MZP56
Image
Part Number
Description
Manufacturer
Datasheet
Request
R

Part Number:
Description:
MPC5 1K0 5%
Manufacturer:
TE Connectivity
Datasheet:

Part Number:
Description:
MPC5 500R 5%
Manufacturer:
TE Connectivity
Datasheet:

Part Number:
Description:
MPC5 5K0 5%
Manufacturer:
Tyco Electronics
Datasheet:

Part Number:
Description:
MPC5 5R0 5%
Manufacturer:
Tyco Electronics
Datasheet:

Part Number:
Description:
MPC5 50K 5%
Manufacturer:
Tyco Electronics
Datasheet:

Part Number:
Description:
MPC5 1R0 5%
Manufacturer:
Tyco Electronics
Datasheet:

Part Number:
Description:
TOWER ELEVATOR BOARDS HARDWARE
Manufacturer:
Freescale Semiconductor
Datasheet:

Part Number:
Description:
TOWER SERIAL I/O HARDWARE
Manufacturer:
Freescale Semiconductor
Datasheet:

Part Number:
Description:
LCD MODULE FOR TWR SYSTEM
Manufacturer:
Freescale Semiconductor
Datasheet:

Part Number:
Description:
DAUGHTER LCD WVGA I.MX51
Manufacturer:
Freescale Semiconductor
Datasheet:

Part Number:
Description:
TOWER SYSTEM BOARD MPC5125
Manufacturer:
Freescale Semiconductor
Datasheet:


